- Subscribe to RSS Feed
- Mark Topic as New
- Mark Topic as Read
- Float this Topic for Current User
- Bookmark
- Subscribe
- Mute
- Printer Friendly Page
Discussions
Solve problems, and share tips and tricks with other JMP users.- JMP User Community
- :
- Discussions
- :
- Re: Plot 2 different X and Ys over each other.
- Mark as New
- Bookmark
- Subscribe
- Mute
- Subscribe to RSS Feed
- Get Direct Link
- Report Inappropriate Content
Plot 2 different X and Ys over each other.
Hey Folks,
Im trying to overlay 2 different x and Y coordinates over each other.
one has 109pts and the other has 25pts.
I am using the scatter plot matrix but it doesn't look so tidy or clear.
Is there an easier way to graph this so I can see where the 27pts are on the 109pt map?
Accepted Solutions
- Mark as New
- Bookmark
- Subscribe
- Mute
- Subscribe to RSS Feed
- Get Direct Link
- Report Inappropriate Content
Re: Plot 2 different X and Ys over each other.
- Mark as New
- Bookmark
- Subscribe
- Mute
- Subscribe to RSS Feed
- Get Direct Link
- Report Inappropriate Content
Re: Plot 2 different X and Ys over each other.
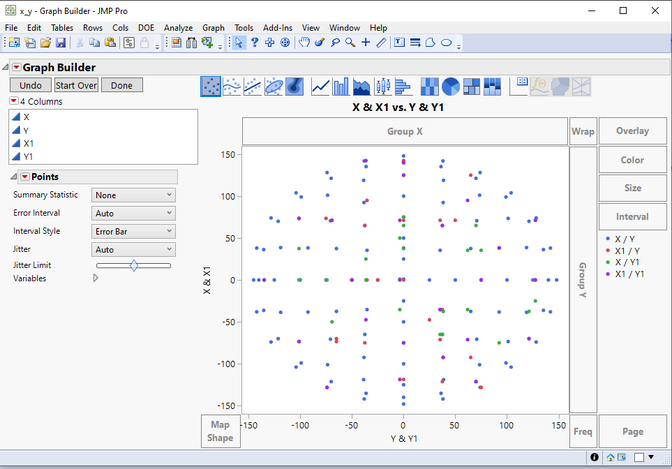
I suggest you use Graph Builder
- Mark as New
- Bookmark
- Subscribe
- Mute
- Subscribe to RSS Feed
- Get Direct Link
- Report Inappropriate Content
Re: Plot 2 different X and Ys over each other.
Yes I was able to make the X/Y1 and X1/Y transparent so works perfect now. Thanks
- Mark as New
- Bookmark
- Subscribe
- Mute
- Subscribe to RSS Feed
- Get Direct Link
- Report Inappropriate Content
Re: Plot 2 different X and Ys over each other.
Could something like this be helpful?
First I created new column (Label) and added 109pts values for the coordinates which have more values. They I copy-pasted X1 and Y1 to X and Y and gave them label 25pts.You could make the points more visible by changing coloring and markers
Data table attached.
- Mark as New
- Bookmark
- Subscribe
- Mute
- Subscribe to RSS Feed
- Get Direct Link
- Report Inappropriate Content
Re: Plot 2 different X and Ys over each other.
many thanks!
- Mark as New
- Bookmark
- Subscribe
- Mute
- Subscribe to RSS Feed
- Get Direct Link
- Report Inappropriate Content
Re: Plot 2 different X and Ys over each other.
Also when data looks like this:
In my opinion this would indicate that the first 25 rows of parts/ids/something have two sets of coordinates X/Y and X1/Y1 and the rest only has one set. If this is not the case I would concatenate the data into one column of coordinates and add some sort of labeling. BUT if the two sets of coordinates are there on purpose for the first 25 rows, just using labeling wouldn't most likely be enough and I would suggest also adding some sort of ID (in this case it could be row number if there is nothing else) to allow you to see which labels have two sets (data table x_y_label_id.jmp has label column and row column as id).
Recommended Articles
- © 2026 JMP Statistical Discovery LLC. All Rights Reserved.
- Terms of Use
- Privacy Statement
- Contact Us


