- Instantly extract effect sizes, F-ratios, and FDR-adjusted p-values from your models with the Calculate Effects Sizes extension, available now in the JMP Marketplace!
- New to JMP? Join us Sept. 23-24 for the Early User Edition of Discovery Summit, tailor-made for new users. Register now for free!
- Your voice matters! Tell us how you prefer to receive JMP updates, so we can tailor our communication to your needs. Take short survey.
- Subscribe to RSS Feed
- Mark Topic as New
- Mark Topic as Read
- Float this Topic for Current User
- Bookmark
- Subscribe
- Mute
- Printer Friendly Page
Discussions
Solve problems, and share tips and tricks with other JMP users.- JMP User Community
- :
- Discussions
- :
- Pairwise comparison on interaction term

- Mark as New
- Bookmark
- Subscribe
- Mute
- Subscribe to RSS Feed
- Get Direct Link
- Report Inappropriate Content
Pairwise comparison on interaction term

- Mark as New
- Bookmark
- Subscribe
- Mute
- Subscribe to RSS Feed
- Get Direct Link
- Report Inappropriate Content
Re: Pairwise comparison on interaction term
Hi @Sarettathepooh,
Can you explain a little bit more about what kind of comparison you are interested in making? When you have one continuous and one categorical factor, the interaction term is a test of whether the differences among the levels of your categorical factor differ at different levels of your continuous variable (or alternatively and equivalently, whether the slope between Y and your continuous X variable varies at different levels of your categorical factor). For instance, in a model predicting Weight from age, height, and age*height (from Big Class.jmp), we can see the interaction both ways with the prediction profiler.

Now, to your point about pairwise comparisons, if you wish to compare levels of your categorical factor, you would do so under the main effect Red Triangle. Those tests would be of the mean response for each level of the categorical variable at the mean level of the continuous variable. In a model with an interaction, it becomes important to ask at what level of the continuous variable those comparisons are made at. The mean is the typical default (and this is what JMP will do unless told to do something else). If what you're looking for is a comparison of the mean responses for the different levels of your factor, at something other than the mean level of the continuous variable, you won't find that test under the interaction term; rather, you find that under the same main effect red triangle, but using the LSMeans Contrast command. In the gif below, you can see me comparing the 12-year-olds and 13-year-olds, but at 70" for height.

I hope this helps!

- Mark as New
- Bookmark
- Subscribe
- Mute
- Subscribe to RSS Feed
- Get Direct Link
- Report Inappropriate Content
Re: Pairwise comparison on interaction term
Hi @jules,
This is very instructive thank you for providing this and for your explanation! I did not understand how specified contrasts could be used in this way - that is, specifically in the context of one continuous and one categorical predictor versus a continuous response.
I've watched some of your previous online content (https://youtu.be/3skUZZF-CuE) where you discussed the general utility of running specified contrasts. Could you attempt to summarize the practical advantages (and disadvantages) here in this forum?
I'm intersted in understanding better how I can use contrasts within my LS regression models (run in Fit Model) to test for specific comparisons, and why - if at all - making these comparisons gives me anything different or more valuable than simply interpreting the results of my standard multiple comparisons outputs? (Tukey HSD detailed pair-wise comparisons and/or connecting letters reports) in Fit Model?
Thanks, @PatrickGiuliano

- Mark as New
- Bookmark
- Subscribe
- Mute
- Subscribe to RSS Feed
- Get Direct Link
- Report Inappropriate Content
Re: Pairwise comparison on interaction term
Hi @PatrickGiuliano,
Absolutely! I keep intending to write a blog about this, so what I did is recorded a quick tutorial introducing some of the ways I use contrasts (which I can do more quickly), and I'll carve out some time to start working on a blog that covers these topics in some more detail. Hope this is a helpful start!
- Mark as New
- Bookmark
- Subscribe
- Mute
- Subscribe to RSS Feed
- Get Direct Link
- Report Inappropriate Content
Re: Pairwise comparison on interaction term
Hi @jules Yes this is great thanks, definitely a great start and I look forward to the Blog post. I hope you don't mind if I follow-up with some further questions as I study and reflect on your commentary in this video. :)
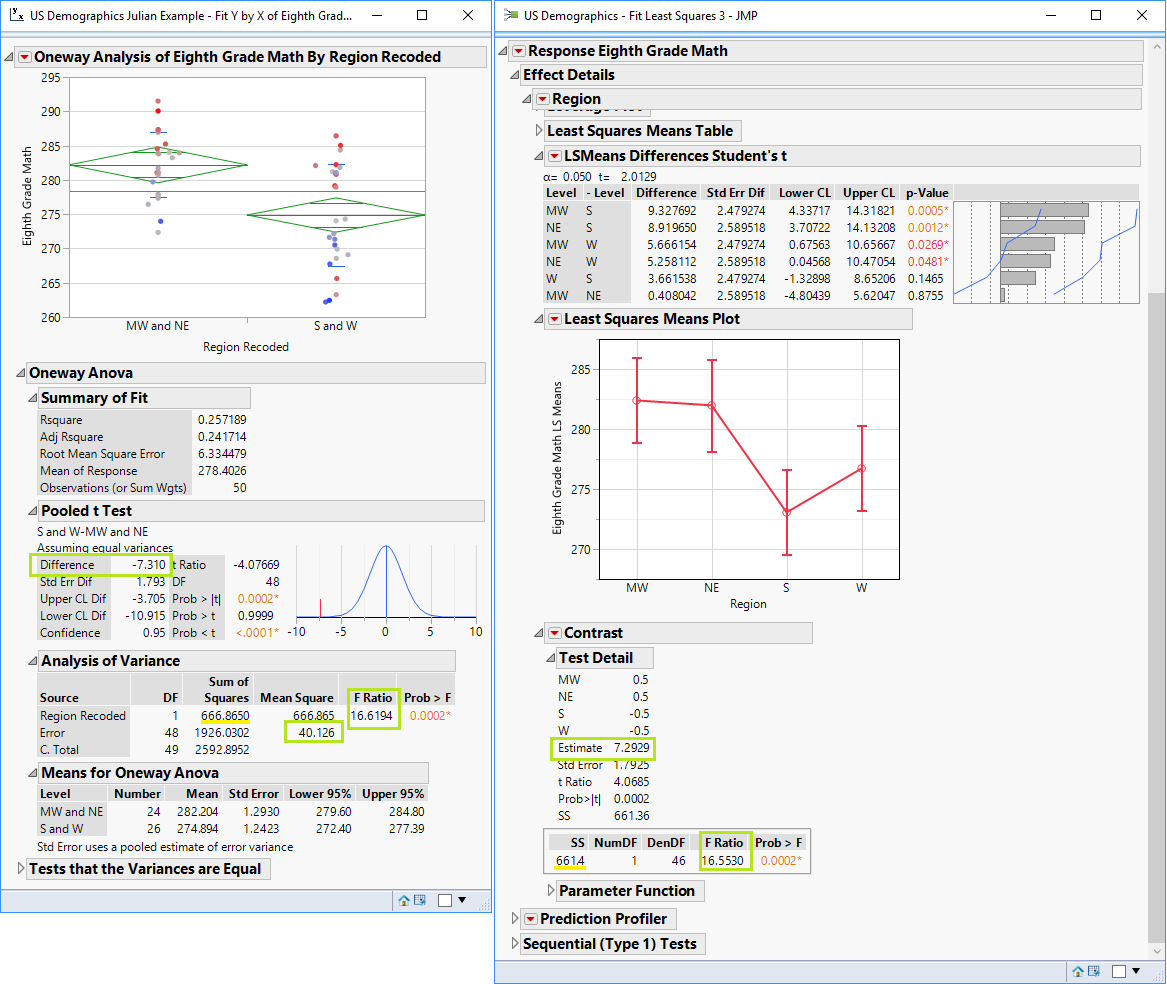
For starters: I'm curious about about the US Demographics example you showed in the context of comparing S and W vs. MW and NE regions using a specified contrast, vs. simply re-coding by lumping S/W and M/NE into Group 1 and Group 2 respectively and then running an ANOVA. A couple things I observed were a little puzzling to me: why is it that the estimate of the mean difference is 7.2929 in the Contrasts Panel, but in the ANOVA it is 7.310? I know the difference is very very small, but is the mean being calculated slightly differently here?
I know you mentioned the mean is NOT changing, its the Variances that are being calculated differently! And to that point, in this example we observe an F Ratio from the Contrasts panel fo 16.5530 vs an F Ratio of 16.6194 using the ANOVA on the recoded (lumped) n of 2 groups. I see the MSE in the ANOVA output, it is 40.126. I don't see the MSE for the contrasts test in Fit-Model, but anyway my question here is: Shouldn't the F Ratio for the contrasts test be larger than for the ANOVA because of more precision on the estimate of MSE in the denominator (and therefore a smaller MSE)? In this case it is the opposite of what I thought it would always be: smaller for the contrasts test as compared to the ANOVA (I know the difference numerically is practically negligible but it's still making me question my understanding of what you're fundamentally asserting). Thanks!
- Mark as New
- Bookmark
- Subscribe
- Mute
- Subscribe to RSS Feed
- Get Direct Link
- Report Inappropriate Content
Re: Pairwise comparison on interaction term
Hi @PatrickGiuliano,
Great questions!
Estimate of mean difference: you're right, the estimate of the mean differences there is a little different, and I glossed over a complexity here. When you do not have equally sized groups, as is the case here (there are different numbers of states in each of the regions), the least squares means in an ANOVA model will differ from the means that you would calculate by summing up the observations in the group and dividing by the number of individuals in the group. You can read about the estimations of LSMeans in the JMP Docs, or elsewhere, but most briefly, they're predicted population margins, estimates of the marginal means in a balanced population. So, that's the origin of this difference there - when we recode the groups and calculate a difference based on those LSmeans, that will be different from first estimating the LSmeans and then averaging those. If the group sizes were all equal, there would be no difference.
This is a regrettable inconsistency you've noticed in my poorly chosen example :) Even though the MSE is smaller in the example using the contrasts, as it should be based on what I was saying (39.954 vs 40.126, and you can find this MSE in the regular ANOVA table -- a contrast uses the model's MSE) because the mean difference is slightly larger in the example where we recoded (for the reason above), the F Ratio ends up being larger in that example. Not the best example, I really should have used a dataset where the groups are equally sizes, or one where the benefit conferred by using the contrasts rather than recoding was more substantial (which is usually the case). I'll certainly choose a different example for the upcoming blog. Thanks for so carefully watching this video!
- Mark as New
- Bookmark
- Subscribe
- Mute
- Subscribe to RSS Feed
- Get Direct Link
- Report Inappropriate Content
Re: Pairwise comparison on interaction term
@jules you're quite welcome thanks for posting it! -- I link it here for the purposes of making it easy for anyone visiting this post to view: https://www.youtube.com/watch?v=k3zk45WrmUI
I've enjoyed them all and it would be great in tandem with the blog you're planning - to keep making more of these from time to time: I am sure I'm not the only one in the community that benefits hugely from them.
Your response makes sense so thanks for that, I see how the resulting difference in LS mean calculation affected the resulting F-ratio (and subsequent p-value) between these two analyses. It actually never occurred to me that the fit model platform in the context of this Contrast tests was calculating a LS mean, though I should have known better since I've used the LS means to interpret relative differences between groups in the context of an OLS regression model in Fit Model many times before.
But I've continued to struggle over the years developing a decent enough understanding of the difference between the LS mean and the regular mean -- and therefore in a way that I can explain it to others. This is the best reference I could find widely available on the Internet. http://onbiostatistics.blogspot.com/2009/04/least-squares-means-marginal-means-vs.html
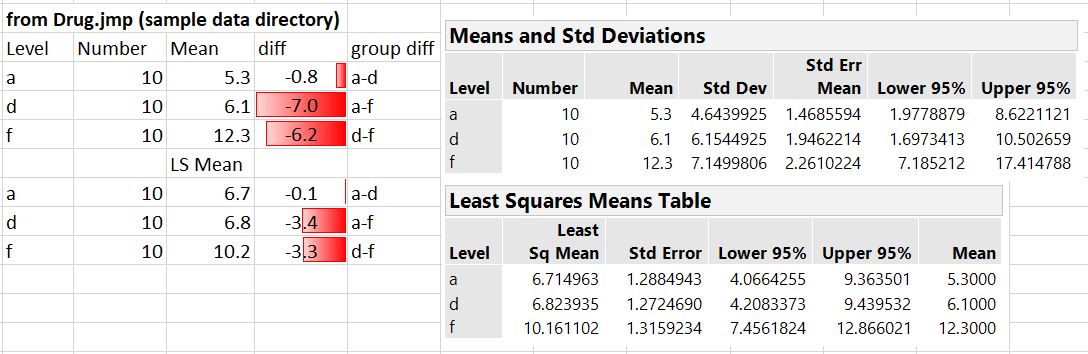
Also, is it true that the LS means tend to be closer together than the actual means (assuming an unbalanced data structure) and therefore we should be careful not to make a type II error (failing to detect a difference when there really is one) when interpreting the differences between them? I tried this out on the example data that JMP suggests (Drug.jmp from the Statistics Index "Run Example" that is associated with the "least square means" topic), and I do get differences that are smaller in the LS means case vs. the standard means where in this case there are equal sample sizes between groups (see attached image of relevant analysis output and calculations in MS Excel).
Finally, do you think we could work together to come up with a nice prototypical example (using simulated data or data already in sample directory) that clearly and practically conveys the conceptual difference between LS means and regular means?
I'm open to ideas! (and I'd be happy to post as a separate Discussion on the Community if that makes more sense).

Recommended Articles
- © 2026 JMP Statistical Discovery LLC. All Rights Reserved.
- Terms of Use
- Privacy Statement
- Contact Us