Turn on suggestions
Auto-suggest helps you quickly narrow down your search results by suggesting possible matches as you type.
- JMP Statement Regarding Critical PHP Remote Code Execution Vulnerabilities (CVE-2026-109618, CVE-2026-109619)
- Don’t miss your chance to experience Discovery Summit Europe at our best available rate! Early bird registration through 31 Oct.
- Graph Builder Toolbar streamlines interactive graphing. Creates shortcuts on Report and GraphBuilder Helpers toolbars. Download and install the extension.
Options
- Subscribe to RSS Feed
- Mark Topic as New
- Mark Topic as Read
- Float this Topic for Current User
- Bookmark
- Subscribe
- Mute
- Printer Friendly Page
Discussions
Solve problems, and share tips and tricks with other JMP users.- User Community
- :
- Discussions
- :
- Overlay different plot type for different data set

Level I
- Mark as New
- Bookmark
- Subscribe
- Mute
- Subscribe to RSS Feed
- Get Direct Link
- Report Inappropriate Content
Overlay different plot type for different data set
Created:
Jul 29, 2020 03:52 PM
| Last Modified: Jun 11, 2023 4:04 AM
(3644 views)
I want to have a scatter plot for dataset 1 and line plot for dataset 2 in a single plot or graph builder. It is more like the way we can change the plot type for different dataset in excel, when both dataset are plotted in a single graph. Any idea how to do that in graph builder
3 REPLIES 3


Super User
- Mark as New
- Bookmark
- Subscribe
- Mute
- Subscribe to RSS Feed
- Get Direct Link
- Report Inappropriate Content
Re: Overlay different plot type for different data set
JMP Platforms (i.e. Graph Builder) requires that all data that is going to be plotted has to be in a single data table or in virtually linked data tables.
Jim

Level III
- Mark as New
- Bookmark
- Subscribe
- Mute
- Subscribe to RSS Feed
- Get Direct Link
- Report Inappropriate Content
Re: Overlay different plot type for different data set
Have you tried copy and paste frame contents while both are plotted in separate graph builder?


Staff
- Mark as New
- Bookmark
- Subscribe
- Mute
- Subscribe to RSS Feed
- Get Direct Link
- Report Inappropriate Content
Re: Overlay different plot type for different data set
Created:
Jul 30, 2020 01:17 PM
| Last Modified: Jul 30, 2020 10:21 AM
(3574 views)
| Posted in reply to message from mrq 07-29-2020
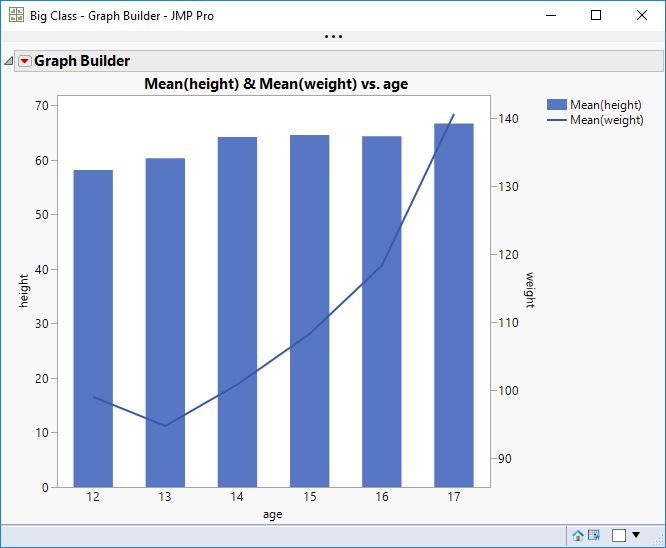
You can have more than one variable in the Y or X role. Right-click on the axis and select Move to place one of the variables on the opposite side. Then right-click in the plot frame and independently change the plotting elements for each of the variables.
Recommended Articles
- © 2026 JMP Statistical Discovery LLC. All Rights Reserved.
- Terms of Use
- Privacy Statement
- Contact Us