- New to JMP? Join us Sept. 23-24 for the Early User Edition of Discovery Summit, tailor-made for new users. Register now for free!
- Your voice matters! Tell us how you prefer to receive JMP updates, so we can tailor our communication to your needs. Take short survey.
- See how to access JMP Marketplace - and - find, create & share add-ins to extend your JMP. Watch video.
- Subscribe to RSS Feed
- Mark Topic as New
- Mark Topic as Read
- Float this Topic for Current User
- Bookmark
- Subscribe
- Mute
- Printer Friendly Page
Discussions
Solve problems, and share tips and tricks with other JMP users.- JMP User Community
- :
- Discussions
- :
- One-sided confidence intervals for proportions

- Mark as New
- Bookmark
- Subscribe
- Mute
- Subscribe to RSS Feed
- Get Direct Link
- Report Inappropriate Content
One-sided confidence intervals for proportions
I have been using JMP to calculate confidence intervals for proportions and I have been wondering: JMP automatically calculates two-sided confidence intervals, right? If i needed for example a one-sided 90% lower confidence interval, I would have to have JMP calculate a two-sided 80% confidence interval and the only use the lower limit?
Thank you in advance.

- Mark as New
- Bookmark
- Subscribe
- Mute
- Subscribe to RSS Feed
- Get Direct Link
- Report Inappropriate Content
Re: One-sided confidence intervals for proportions
Yes, that approach should give you the limit that you want.

- Mark as New
- Bookmark
- Subscribe
- Mute
- Subscribe to RSS Feed
- Get Direct Link
- Report Inappropriate Content
Re: One-sided confidence intervals for proportions
I need to show one-sided confidence interval for a linear regression curve (95%, one-sided, per ICH stability analysis for shelf life of drug products). Using 90% (0.10 alpha) will generate, but also shows both upper and lower CI's. Is there any way to just plot the upper 90% CI curve? It wasn't an option in the past (had to resort to Sigma Plot...ugh).

- Mark as New
- Bookmark
- Subscribe
- Mute
- Subscribe to RSS Feed
- Get Direct Link
- Report Inappropriate Content
Re: One-sided confidence intervals for proportions
1. Use Fit model to build your linear regression.
1a. Before you click run in the fit model use the Model Specification red triangle to select you alpha level (if not 0.05)
2. Now run the model
3. From the model red triangle select Save>Mean Confidence Interval
4. Go back to your data table and use graph builder to graph the data, the fitted curve (GB can fit line, quadratic - if more complex then you might have to save the fitted model as well), and the CI data for the side you are interested in.
- Mark as New
- Bookmark
- Subscribe
- Mute
- Subscribe to RSS Feed
- Get Direct Link
- Report Inappropriate Content
Re: One-sided confidence intervals for proportions
Karen,
That's an interesting work around. Haven't seen how to do the following in BG though: show 1 lot (the worst case, regressed lot) as a data symbol different from the symbol for all other lots (granted, a bit odd, but something our consultant guided us to), and also show the regression line and upper-only CI for that 1 lot. Seems like showing lines in BG is all lots or none. Worst case I could export that data and do that (painfully) in Excel.
Thanks!
- Mark as New
- Bookmark
- Subscribe
- Mute
- Subscribe to RSS Feed
- Get Direct Link
- Report Inappropriate Content
Re: One-sided confidence intervals for proportions
GB has tons of flexibility, I am always learning of a new GB option. I would recomend some light reading:https://www.jmp.com/support/help/14/graph-builder.shtml.
But yes, you can show one lot as a different symbol than the others. I will assume that your data is unstacked - so each lot in a column....drag all of the colums to the Y (if you select them and then drag all at once it might be easiest).Then you can either right click on the graph and bring up the customize window to select the lot you want to change markers for or you can double click on the legend and in the section with the check boxes for including (or excluding) items in the legend you can right click on the marker symbol you want to change and customize it there. Similar process if you data is stacked and you are using lot as an overlay variable.
- Mark as New
- Bookmark
- Subscribe
- Mute
- Subscribe to RSS Feed
- Get Direct Link
- Report Inappropriate Content
Re: One-sided confidence intervals for proportions
I don't know how to plot only one of the limits. I assume that you are using the Bivariate platform, which will plot confidence curves or shaded areas for the fit or for individual observations. On the other hand, you can use inverse prediction in Fit Least Squares platform and get a numerical and graphical result for the one-sided limit. This way is how we teach determining expiry in our JMP Software: Stability Analysis course.
You can specify the lower limit and the confidence level directly. Here I am determining the height that corresponds to a weight = 100:

Here is the result:

Would this result work for you?
- Mark as New
- Bookmark
- Subscribe
- Mute
- Subscribe to RSS Feed
- Get Direct Link
- Report Inappropriate Content
Re: One-sided confidence intervals for proportions
Mark,
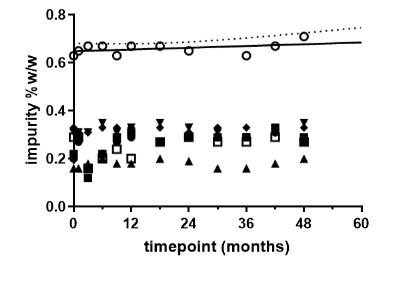
I'm working with linear regression for an impurity vs time, with multiple lots plotted together. Goal is to show only the worst case lot's regression line and its 1-sided 95% confidence interval (the hack in Prism - capture plot attached, hopefully - was to use 2-sided 90% confidence and just not show the lower CI curve).
Sorry, but I'm lost in where to go for the inverse prediction in Fit Least Squares - in the Bivariate Y by X ?
Thanks
Steve
- Mark as New
- Bookmark
- Subscribe
- Mute
- Subscribe to RSS Feed
- Get Direct Link
- Report Inappropriate Content
Re: One-sided confidence intervals for proportions
First of all, your plot shows an aberrant lot. The lot to lot variance does not account for such a difference. A special cause had an effect. Is the special cause known? Should this lot determine the expiry for future lots?
Secondly, which ICH guidance are you following, Q1E or Q1A? They recommend pooling the data from all your lots and determining if the change over time is consistent from one batch to another. This method fits a model to all the data with a term for time, lot, and time crossed with lot.
Lastly, I apologize for not explaining how to use the inverse prediction. Select Analyze > Fit Model. (This much is the same as Karen's suggestion.) Select the data column with the impurity data and click Y. Select the data column with the months and click Add. (At this point, you could have selected months and lot, click Macros, and select Factorial to Degree to use the pooling approach. If you are interested in pursuing pooling, let me know and I will explain further in another response.) Now click Run. From here, click the red triangle at the top and select Estimates > Inverse Prediction. Now follow the steps described in a previous post.
Hope this helps!
- Mark as New
- Bookmark
- Subscribe
- Mute
- Subscribe to RSS Feed
- Get Direct Link
- Report Inappropriate Content
Re: One-sided confidence intervals for proportions
Mark
Yes, that lot is different (due to different drug substance lot). We were trying to be able to pool stability regression slopes, even when the intercepts weren't poolable - to get shelf-life estimates as the end game (per Q1E). Complementary to the JMP Analyze/Reliability/Degradation/Stability routine, we were plotting all the lot data on a single graph, and that's where we wanted to show the alternative worst case (not pooling the data) and show the regression and 1-sided 95% CI for whatever lot would show the greatest change over time.
I see the Inverse routine - hadn't ever ventured into that corner of JMP, thanks.
steve
Recommended Articles
- © 2026 JMP Statistical Discovery LLC. All Rights Reserved.
- Terms of Use
- Privacy Statement
- Contact Us