- New to JMP? Join us Sept. 23-24 for the Early User Edition of Discovery Summit, tailor-made for new users. Register now for free!
- Subscribe to RSS Feed
- Mark Topic as New
- Mark Topic as Read
- Float this Topic for Current User
- Bookmark
- Subscribe
- Mute
- Printer Friendly Page
Discussions
Solve problems, and share tips and tricks with other JMP users.- JMP User Community
- :
- Discussions
- :
- One chart with Different Reference Lines for Different Products

- Mark as New
- Bookmark
- Subscribe
- Mute
- Subscribe to RSS Feed
- Get Direct Link
- Report Inappropriate Content
One chart with Different Reference Lines for Different Products
Hello,
Attached is a table1.jmp with 3 columns that I will use to plot a chart. Table2 is a table with Reference Lines information. Also attached is the output_chart.png that I am trying to accomplish. Is it possible to write a jsl to plot a chart and input the reference lines information that are different for different product. I also won't mind any other way to plot the chart. Any help is greatly appreciated!
Accepted Solutions

- Mark as New
- Bookmark
- Subscribe
- Mute
- Subscribe to RSS Feed
- Get Direct Link
- Report Inappropriate Content
Re: One chart with Different Reference Lines for Different Products
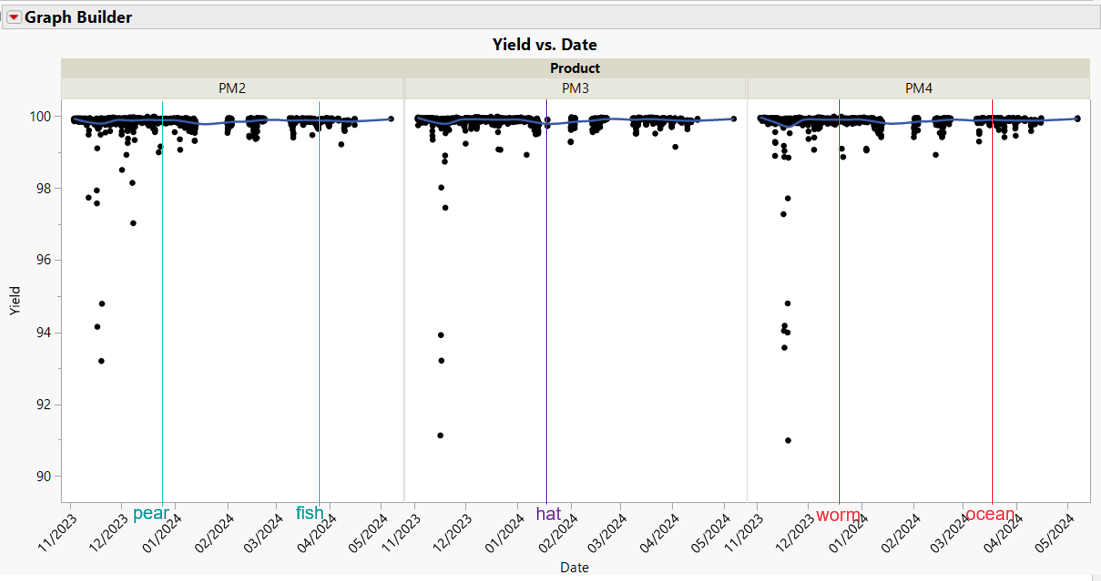
Here is the best I could do. It required a table change to allow for Graph Builder to have separate X axes for each product.
Names Default To Here( 1 );
dt = Data Table( "Table1" );
dt << New Column( "PM2 date",
	formula( If( :Product == "PM2", :Date, . ) ),
	Format( "m/d/y h:m:s" )
);
dt << New Column( "PM3 date",
	formula( If( :Product == "PM4", :Date, . ) ),
	Format( "m/d/y h:m:s" )
);
dt << New Column( "PM4 date",
	formula( If( :Product == "PM2", :Date, . ) ),
	Format( "m/d/y h:m:s" )
);
dtRefLineDef = Data Table( "Table2" );

Graph Builder(
	Size( 534, 464 ),
	Show Control Panel( 0 ),
	Variables( X( :PM2 Date ), X( :PM3 Date ), X( :PM4 Date ), Y( :Yield ) ),
	Elements(
		Position( 1, 1 ),
		Points( X, Y, Legend( 9 ) ),
		Smoother( X, Y, Legend( 10 ) )
	),
	Elements(
		Position( 2, 1 ),
		Points( X, Y, Legend( 11 ) ),
		Smoother( X, Y, Legend( 12 ) )
	),
	Elements(
		Position( 3, 1 ),
		Points( X, Y, Legend( 13 ) ),
		Smoother( X, Y, Legend( 14 ) )
	),
	SendToReport(
		Dispatch( {}, "400", ScaleBox,
			{Legend Model(
				9,
				Properties( 0, {Line Color( 0 )}, Item ID( "Yield", 1 ) )
			), Legend Model(
				10,
				Properties( 0, {Line Color( 0 )}, Item ID( "Smooth", 1 ) )
			), Legend Model(
				11,
				Properties( 0, {Line Color( 0 )}, Item ID( "Yield", 1 ) )
			), Legend Model(
				12,
				Properties( 0, {Line Color( 0 )}, Item ID( "Smooth", 1 ) )
			), Legend Model(
				13,
				Properties( 0, {Line Color( 0 )}, Item ID( "Yield", 1 ) )
			), Legend Model(
				14,
				Properties( 0, {Line Color( 0 )}, Item ID( "Smooth", 1 ) )
			)}
		),
		Dispatch( {}, "400", LegendBox,
			{Legend Position(
				{9, [-1], 10, [-1], 11, [-1], 12, [-1], 13, [-1], 14, [-1]}
			)}
		)
	)
);

gbr = Current Report();

For( i = 1, i <= N Rows( dtRefLineDef ), i++,
	If(
		dtRefLineDef:Product[i] == "PM2", box = 1,
		dtRefLineDef:Product[i] == "PM3", box = 3,
		dtRefLineDef:Product[i] == "PM4", box = 4
	);
	gbr[axisbox( box )] << add ref line(
		dtRefLineDef:Design Change Dates[i], "Solid", "Black",
		dtRefLineDef:Design Name[i]
	);
);

- Mark as New
- Bookmark
- Subscribe
- Mute
- Subscribe to RSS Feed
- Get Direct Link
- Report Inappropriate Content
Re: One chart with Different Reference Lines for Different Products
If you are using JMP18, this is other option you could try
Names Default To Here(1);

dt1 = Open("$DOWNLOADS/table1.jmp");
dt2 = Open("$DOWNLOADS/table2.jmp");

gb = dt1 << Graph Builder(
	Size(1162, 468),
	Show Control Panel(0),
	Link Page Axes("Y Only"),
	// Replicate Linked Page Axes(0), // would show Y-axis only once
	Variables(X(:Date), Y(:Yield), Page(:Product, Levels per Row(3), Show Title(0))),
	Elements(Points(X, Y, Legend(4)), Smoother(X, Y, Legend(5)))
);

// get PM list
Summarize(dt1, pms = By(:Product));

// Each X-Group will have its own framebox
// NOTE We assume that PM order is the default one
all_axis = Report(gb) << XPath("//AxisBox");
abs = all_axis[1::N Items(all_axis)::2];

For Each({cur_pm, idx}, pms,
	cur_ab = abs[idx];
	// Loop over line specifications and set lines
	pm_spec_rows = dt2 << get rows where(:Product == cur_pm);
	For Each({spec_row}, pm_spec_rows,
		val = dt2[spec_row, "Design Change Dates"];
		name = dt2[spec_row, "Design Name"];
		cur_ab << Add Ref Line(val, "Solid", "Red", name, 1);
	);
);
It utilizes new "grid" style when using Page. This allows us to have separate X-axis for each of the groups

You can also show the Y-axis only once if you change Replicate Linked Page Axes setting

- Mark as New
- Bookmark
- Subscribe
- Mute
- Subscribe to RSS Feed
- Get Direct Link
- Report Inappropriate Content
Re: One chart with Different Reference Lines for Different Products
- Mark as New
- Bookmark
- Subscribe
- Mute
- Subscribe to RSS Feed
- Get Direct Link
- Report Inappropriate Content
Re: One chart with Different Reference Lines for Different Products
Here is the best I could do. It required a table change to allow for Graph Builder to have separate X axes for each product.
Names Default To Here( 1 );
dt = Data Table( "Table1" );
dt << New Column( "PM2 date",
	formula( If( :Product == "PM2", :Date, . ) ),
	Format( "m/d/y h:m:s" )
);
dt << New Column( "PM3 date",
	formula( If( :Product == "PM4", :Date, . ) ),
	Format( "m/d/y h:m:s" )
);
dt << New Column( "PM4 date",
	formula( If( :Product == "PM2", :Date, . ) ),
	Format( "m/d/y h:m:s" )
);
dtRefLineDef = Data Table( "Table2" );

Graph Builder(
	Size( 534, 464 ),
	Show Control Panel( 0 ),
	Variables( X( :PM2 Date ), X( :PM3 Date ), X( :PM4 Date ), Y( :Yield ) ),
	Elements(
		Position( 1, 1 ),
		Points( X, Y, Legend( 9 ) ),
		Smoother( X, Y, Legend( 10 ) )
	),
	Elements(
		Position( 2, 1 ),
		Points( X, Y, Legend( 11 ) ),
		Smoother( X, Y, Legend( 12 ) )
	),
	Elements(
		Position( 3, 1 ),
		Points( X, Y, Legend( 13 ) ),
		Smoother( X, Y, Legend( 14 ) )
	),
	SendToReport(
		Dispatch( {}, "400", ScaleBox,
			{Legend Model(
				9,
				Properties( 0, {Line Color( 0 )}, Item ID( "Yield", 1 ) )
			), Legend Model(
				10,
				Properties( 0, {Line Color( 0 )}, Item ID( "Smooth", 1 ) )
			), Legend Model(
				11,
				Properties( 0, {Line Color( 0 )}, Item ID( "Yield", 1 ) )
			), Legend Model(
				12,
				Properties( 0, {Line Color( 0 )}, Item ID( "Smooth", 1 ) )
			), Legend Model(
				13,
				Properties( 0, {Line Color( 0 )}, Item ID( "Yield", 1 ) )
			), Legend Model(
				14,
				Properties( 0, {Line Color( 0 )}, Item ID( "Smooth", 1 ) )
			)}
		),
		Dispatch( {}, "400", LegendBox,
			{Legend Position(
				{9, [-1], 10, [-1], 11, [-1], 12, [-1], 13, [-1], 14, [-1]}
			)}
		)
	)
);

gbr = Current Report();

For( i = 1, i <= N Rows( dtRefLineDef ), i++,
	If(
		dtRefLineDef:Product[i] == "PM2", box = 1,
		dtRefLineDef:Product[i] == "PM3", box = 3,
		dtRefLineDef:Product[i] == "PM4", box = 4
	);
	gbr[axisbox( box )] << add ref line(
		dtRefLineDef:Design Change Dates[i], "Solid", "Black",
		dtRefLineDef:Design Name[i]
	);
);
- Mark as New
- Bookmark
- Subscribe
- Mute
- Subscribe to RSS Feed
- Get Direct Link
- Report Inappropriate Content
Re: One chart with Different Reference Lines for Different Products
Hi Jim,
This is fantastic! I learnt a lot from this.
Thank you!
- Mark as New
- Bookmark
- Subscribe
- Mute
- Subscribe to RSS Feed
- Get Direct Link
- Report Inappropriate Content
Re: One chart with Different Reference Lines for Different Products
If you are using JMP18, this is other option you could try
Names Default To Here(1);

dt1 = Open("$DOWNLOADS/table1.jmp");
dt2 = Open("$DOWNLOADS/table2.jmp");

gb = dt1 << Graph Builder(
	Size(1162, 468),
	Show Control Panel(0),
	Link Page Axes("Y Only"),
	// Replicate Linked Page Axes(0), // would show Y-axis only once
	Variables(X(:Date), Y(:Yield), Page(:Product, Levels per Row(3), Show Title(0))),
	Elements(Points(X, Y, Legend(4)), Smoother(X, Y, Legend(5)))
);

// get PM list
Summarize(dt1, pms = By(:Product));

// Each X-Group will have its own framebox
// NOTE We assume that PM order is the default one
all_axis = Report(gb) << XPath("//AxisBox");
abs = all_axis[1::N Items(all_axis)::2];

For Each({cur_pm, idx}, pms,
	cur_ab = abs[idx];
	// Loop over line specifications and set lines
	pm_spec_rows = dt2 << get rows where(:Product == cur_pm);
	For Each({spec_row}, pm_spec_rows,
		val = dt2[spec_row, "Design Change Dates"];
		name = dt2[spec_row, "Design Name"];
		cur_ab << Add Ref Line(val, "Solid", "Red", name, 1);
	);
);
It utilizes new "grid" style when using Page. This allows us to have separate X-axis for each of the groups
You can also show the Y-axis only once if you change Replicate Linked Page Axes setting
- Mark as New
- Bookmark
- Subscribe
- Mute
- Subscribe to RSS Feed
- Get Direct Link
- Report Inappropriate Content
Re: One chart with Different Reference Lines for Different Products
Jarmo,
I am using JMP17. I am request now for JMP18 from my IT department. I definitely want to try your script to produce such beautiful charts! Thank you!

- Mark as New
- Bookmark
- Subscribe
- Mute
- Subscribe to RSS Feed
- Get Direct Link
- Report Inappropriate Content
Re: One chart with Different Reference Lines for Different Products
Not being a scripter, I tried something different. In the attached I created a column for "new product" in Table 2, and then joined the tables using Product as the key. The stored graph from Graph Builder colored the points by the Design Name, used Product in the Group X field, and selected both Date and Design Change Dates as X variables with Yield as Y. I modified the marker size. I think more could be done to improve the display (at least move PM3 to the right since it had no design changes).
Recommended Articles
- © 2026 JMP Statistical Discovery LLC. All Rights Reserved.
- Terms of Use
- Privacy Statement
- Contact Us