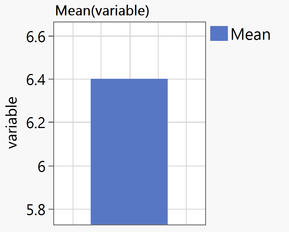
same example as above, with Graph Builder:
dt = New Table( "test",	Add Rows( 2 ),
	New Column( "variable", Set Values( [4, 8] ) ),
	New Column( "N", Set Values( [2000, 3000] ) ),
	New Column( "ratio", Formula( :N / Col Sum( :N )*1000 ))
);
Graph Builder(Variables( Y( :variable ), Frequency( :ratio ) ),	Elements( Bar( Y ) ));
... and the result is 6.4.

so, Graph Builder follows the same lines as the other platforms?

no -- GraphBuilder automatically switches to weight:

... with the previously mentioned impact on other statistics like Median
@hogi wrote:All this definitely makes sense
but nevertheless: surprising when you see it the first time.
and: dangerous - if you don't see it ;)
And the counts (previous post), why is the graph misleading?
Freq doesn't have an impact on Counts - neither in Graph Builder nor in Summary Statistics.
[-> I added a comment to the post on summary statistics]