- Subscribe to RSS Feed
- Mark Topic as New
- Mark Topic as Read
- Float this Topic for Current User
- Bookmark
- Subscribe
- Mute
- Printer Friendly Page
Discussions
Solve problems, and share tips and tricks with other JMP users.- JMP User Community
- :
- Discussions
- :
- Re: Not sure how to use "Weight" in "Analyze"
- Mark as New
- Bookmark
- Subscribe
- Mute
- Subscribe to RSS Feed
- Get Direct Link
- Report Inappropriate Content
Not sure how to use "Weight" in "Analyze"
I want to do something really simple. For simplicity's sake, assume I have two groups, let's say with N=2,000 in group 1 and N=3,000 in group 2. I'd like to compute an overall mean of a variable Y that is collected for each group. Y's mean in group 1 is 4 and in group 2 is 8. The overall mean here would be the unweighted mean and not the weighted mean–it should be 6. I might have thought that I should put in the following values for "Weight":
Group 1: 5,000/2,000
Group 2: 5,000/3,000
But those don't yield the expected number. Can you help me understand the "Weight" option in Analyze:JMP and tell me what weights I need to use for my problem?
- Mark as New
- Bookmark
- Subscribe
- Mute
- Subscribe to RSS Feed
- Get Direct Link
- Report Inappropriate Content
Re: Not sure how to use "Weight" in "Analyze"
Unless I'm misreading your post, one path to finding each group's mean value is to structure the data table with two columns, "Group" as a nominal variable, and "Y" as continuous variable in the second column. Then a simple Distribution platform run with the "Group" variable in the By window, and the "Y" variable in the Y, columns window and you will get two histograms and summary statistic tables, one for each value in the "Group" column. You don't need to bother with the Weight window.
- Mark as New
- Bookmark
- Subscribe
- Mute
- Subscribe to RSS Feed
- Get Direct Link
- Report Inappropriate Content
Re: Not sure how to use "Weight" in "Analyze"
First, Weight is not Freq. If you know what Freq does, then Weight does something different, or extra.
I would like to point to the following two SAS articles:
- Distinction between the WEIGHT and FREQ statements
- The difference between frequencies and weights in regression analysis
In my word, using Weight only if you want to change how individual observations impact your analysis. For example, as in the second article above, one may want to temper the influence of outliers to the analysis.
So whether you want to use weight or not, and how to use it, you may want to ask your self, how it may impact your analysis and how to interpret the impact.
In the example that you gave, and by the way that you describe, I can only imagine that you have some sort of summary data, then you want to use Weight to "correct" the contributions from summary statistics from individual groups. But I am not aware of any JMP platforms were designed to handle summary data, other than some tools under Help>Sample Index. If you data is in its original form, you don't need Weight as my colleague has said.
- Mark as New
- Bookmark
- Subscribe
- Mute
- Subscribe to RSS Feed
- Get Direct Link
- Report Inappropriate Content
Re: Not sure how to use "Weight" in "Analyze"
I think, I understand what you want, but not what for it is needed. And I agree to the answers above, that weight might not be the proper way.
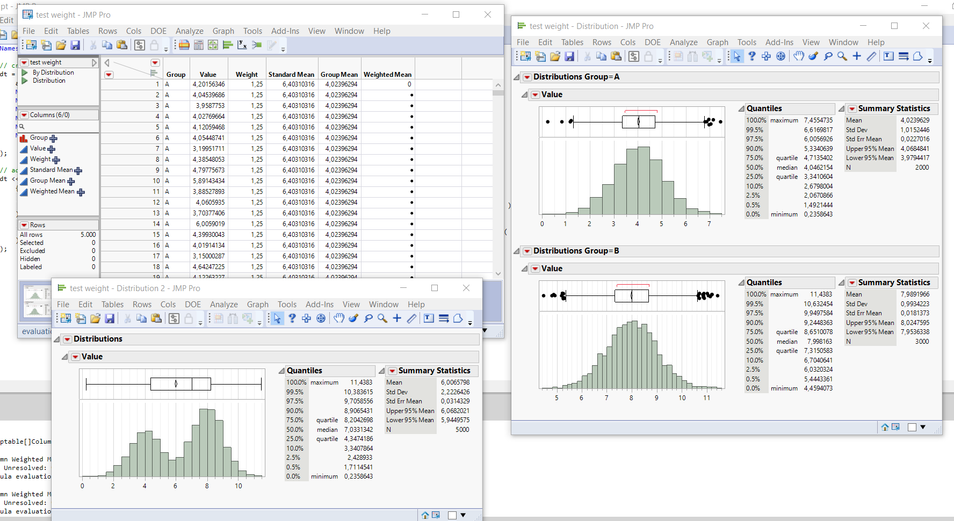
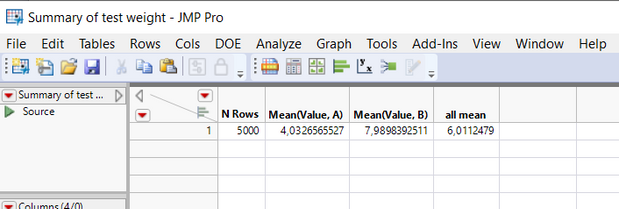
If you want to do it simple, I would use the 2 step approach, first calculating the group means, and then calculating the means of the means (ignoring the frequency).
So this means you want each group weighted evenly, and the average is 6, see second screenshot.
But standard in JMP is, that each row has the same weight, as others pointed out already. And if you really need to do this in one "stacked table", you need to calculate the weights in that way, that the result is what you want, but this might get quite complicate and confusing using more groups - so I do not recommend.
Just for illustration see script below.
Names Default To Here( 1 );

// generate example table
dt = New Table( "test weight",
	add rows( 5000 ),
	New Column( "group", formula( If( Row() > 2000, "B", "A" ) ) ),
	New Column( "value", formula( If( Row() > 2000, Random Normal( 8, 1 ), Random Normal( 4, 1 ) ) ) ),
	New Column( "weight", formula( If( Row() > 2000, 5000 / 6000, 5000 / 4000 ) ) ),
	New Column( "mean", formula( Col Mean( :value ) ) ),
	New Column( "group mean", formula( Col Mean( :value, :group ) ) )
);

dt << add properties to table(
	{new script(
		"By Distribution",
		Distribution( Stack( 1 ), Continuous Distribution( Column( :value ), Horizontal Layout( 1 ), Vertical( 0 ) ), By( :group ) )
	), new script(
		"Weighted Distribution",
		Distribution( Stack( 1 ), Continuous Distribution( Column( :value ), Horizontal Layout( 1 ), Vertical( 0 ) ), weight( :weight ) )
	)}
);

dt_sum = dt << summary( subgroup( :group ), Mean( value ) );

dt_sum << New Column( "all mean", Formula( Mean( :"Mean(value, A)"n, :"Mean(value, B)"n ) ) );
- Mark as New
- Bookmark
- Subscribe
- Mute
- Subscribe to RSS Feed
- Get Direct Link
- Report Inappropriate Content
Re: Not sure how to use "Weight" in "Analyze"
The
- Unlike the FREQ variable whose values must be integers, weights can be fractional.
from Distinction between the WEIGHT and FREQ statements doesn't hold for Jmp?
ignoring fractionals: 6
if fractionals work as well: 6.4 <- result for all 4 cases
same for Analyze/Distribution and Analyze/Tabulate ...
edit:
please also note that N=2, even if freq > 1000
dt = New Table( "test",
	Add Rows( 2 ),
	New Column( "variable", Set Values( [4, 8] ) ),
	New Column( "N", Set Values( [2000, 3000] ) ),
	New Column( "ratio", Formula( :N / Col Sum( :N ) ))
);

dt << Summary( Mean( :variable ), Weight( :N ), output table name( "weight(N)" ) );
dt << Summary( Mean( :variable ), Freq( :N ), output table name( "freq(N)" ) );

dt << Summary( Mean( :variable ), Weight( :ratio ), output table name( "weight(ratio)" ) );
dt << Summary( Mean( :variable ), Freq( :ratio ), output table name( "freq(ratio)" ) );- Mark as New
- Bookmark
- Subscribe
- Mute
- Subscribe to RSS Feed
- Get Direct Link
- Report Inappropriate Content
Re: Not sure how to use "Weight" in "Analyze"
Best documentation for JMP I could quickly find is Fitting Linear Models > Model Specification > Launch the Fit Model Platform > Elements in the Fit M... .
Distribution has its own https://www.jmp.com/support/help/en/17.0/#page/jmp/launch-the-distribution-platform.shtml#
as does tabulate https://www.jmp.com/support/help/en/17.0/#page/jmp/launch-the-tabulate-platform.shtml#
- Mark as New
- Bookmark
- Subscribe
- Mute
- Subscribe to RSS Feed
- Get Direct Link
- Report Inappropriate Content
Re: Not sure how to use "Weight" in "Analyze"
And concerning Summary:
https://www.jmp.com/support/help/en/17.0/index.shtml#page/jmp/summary-launch-window.shtml#ww272136
ah, OK.
Following the first link, I found:
So, slightly hidden, but under the line:
Unlike the FREQ variable whose values must be integers, weights can be fractional.
from Distinction between the WEIGHT and FREQ statements (SAS) doesn't hold for Jmp?
- Mark as New
- Bookmark
- Subscribe
- Mute
- Subscribe to RSS Feed
- Get Direct Link
- Report Inappropriate Content
Re: Not sure how to use "Weight" in "Analyze"
- Mark as New
- Bookmark
- Subscribe
- Mute
- Subscribe to RSS Feed
- Get Direct Link
- Report Inappropriate Content
Re: Not sure how to use "Weight" in "Analyze"
I found this discussion after some surprises with Tables/Summary.
We started by using weight in Tables/Summary along the idea:
and found out that Median is one of the most simple cases to explain the difference between Freq and Weight :)
It always returns the "center" value, independent of weighting. So, using Weight doesn't work.
The "workaround":
If the user wants to weight different values differently in a Median calculation, he has to use Freq, i.e. tell[] the procedure that there are more observations than there are rows in the data set. [The difference between frequencies and weights in regression analysis]
All this definitely makes sense
but nevertheless: surprising when you see it the first time.
and: dangerous - if you don't see it ;)
dt = New Table( "test",
	Add Rows( 120 ),
	Compress File When Saved( 1 ),
	New Column( "X_Value",
		Formula( Row() )
	),
	New Column( "counts",
		Formula( spectris:Gaussian( :X_Value, 1, 100, 5 ) ),
		Set Selected
	)
);

dt << Graph Builder(
	Variables( X( :X_Value ), Y( :counts ) ),
	Elements(
		Points( X, Y, Legend( 3 ) ),
		Smoother( X, Y, Legend( 4 ), Lambda( 0.000002 ) )
	)
);

dt << Summary(
	Mean( :X_Value ),
	Median( :X_Value ),
	Freq( :counts ),
	output table name( "Freq(counts)" )
);

dt << Summary(
	Mean( :X_Value ),
	Median( :X_Value ),
	Weight( :counts ),
	output table name( "Weight(counts)" )
);
- Mark as New
- Bookmark
- Subscribe
- Mute
- Subscribe to RSS Feed
- Get Direct Link
- Report Inappropriate Content
Re: Not sure how to use "Weight" in "Analyze"
@hogi wrote:
Following the first link, I found:
But for Freq in Graph Builder, the values must be integer - otherwise they are ignored:[counts < 10, although Freq ~ 100]
sorry, misleading graph - see below.
Names Default to Here(1);
dt = Open( "$SAMPLE_DATA/Big Class.jmp" );
New Column( "freq",	set each value( 100.5 ));
Graph Builder(
	Variables( X( :sex ), Y( :age ), Frequency( :freq ) ),
	Elements( Heatmap( X, Y, Legend( 5 ), Label( "Label by Value" ) ) )
)
Recommended Articles
- © 2026 JMP Statistical Discovery LLC. All Rights Reserved.
- Terms of Use
- Privacy Statement
- Contact Us


