- Subscribe to RSS Feed
- Mark Topic as New
- Mark Topic as Read
- Float this Topic for Current User
- Bookmark
- Subscribe
- Mute
- Printer Friendly Page
Discussions
Solve problems, and share tips and tricks with other JMP users.- JMP User Community
- :
- Discussions
- :
- Re: Nested/Multiple Data Filter Context Box
- Mark as New
- Bookmark
- Subscribe
- Mute
- Subscribe to RSS Feed
- Get Direct Link
- Report Inappropriate Content
Nested/Multiple Data Filter Context Box
::edit:: Added a comment in the code and included a screenshot to help visualize.
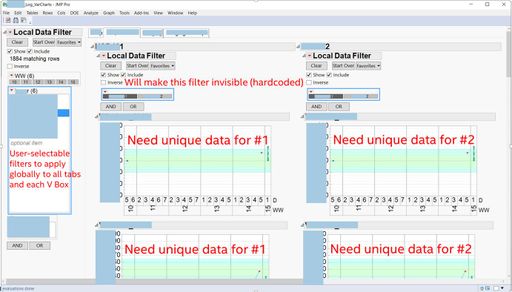
Is it possible to do nested filter context boxes or to generate something that effectively does the same thing? Basically I want a set of parent filters that apply to all plots in a report. The reports within that plot need their own particular filters to limit the data they display.
I have an interactive report layed like this:
(1) An H List box divided into two columns.
(A) The first column contains a set of filters that apply to anything in the second column.
(B) The second column contains a tab box with multiple tabs for different "tool types."
(i) Each tab contains an h list box with a column of variabiity charts for each "tool" of a given type. Each column needs its own filter to limit which "tool" it displays.
(a) This filter is hard coded based on a list, but the VarCharts need to update based on the filters in (A).
What I am finding is that if I put a where() within the variability chart, it ignores the filters in (A). I then tried nesting filter context boxes, but this doesn't seem to work. The new filters show up, but only the parent-most filter actually does anything.
I attempted to create a stripped-down/anonymized version of my code, so there may be some typos:
myRootPath = "C:\Log_Testing\";
myLogPath = myRootPath;
myReportPath = myRootPath || "Report\";
mypath = myRootPath || "Logs\";

// I tools to plot
// format: ToolID
iTools = {"i1", "i5"};

// P tools to plot
// format: ToolID
pTools = {"p1", "p2"};

Set Current Directory( mypath );

mainDt = Open( myLogPath || "Log.jmp" );

Batch Interactive( 1 );  //Batch mode
dt_name = mainDt << get name();
dt_path = myLogPath;
mainDt << Clear Select;

filterContextBox = Data Filter Context Box();

spcWin = New Window( dt_name || "_VarCharts", filterContextBox );

filterBox = H List Box(
	mainDt << Data Filter(
			//Conditional,
		Local,
		Add Filter(
			columns( :WW, :D ),
			Display( :WW, Blocks Display ),
			Display( :D, Blocks Display ),

		),
		Mode( Select( 0 ), Show( 1 ), Include( 1 ) ),
	)
);

filterContextBox << Append( filterbox );
filterBox << Append( tb = Tab Box() );
tb << Add( "P", hPTab = H List Box() );
tb << Add( "I", hITab = H List Box() );

numPTools = N Items( pTools );
numITools = N Items( iTools );

//Create P Plots
For( j = 1, j <= numPTools, j++,

	hPTab << Append( vToolBox = V List Box() );

	vToolBox << Append( toolTab = Outline Box( pTools[j] ) );

	ycol = "VariableName";
	parseName = "Variability Chart for " || ycol;
	toolTab << append(
		NewChart = Variability Chart(
			Y( Column( ycol ) ),
			X( :WW, :D ),
			Max Iter( 100 ),
			Conv Limit( 0.00000001 ),
			Number Integration Abscissas( 128 ),
			Number Function Evals( 65536 ),
			Analysis Type( Name( "Choose best analysis (EMS REML Bayesian)" ) ),
			Connect Cell Means( 1 ),
			Std Dev Chart( 0 ),
			Points Jittered( 0 ),
			AIAG Labels( 0 ),
			Automatic Recalc( 1 ),
/*If the next line isn't commented out, it ignores the local filter and only uses this one. I need both. */
 Where( :ToolID == pTools[j] );
			SendToReport(
				Dispatch( {}, "Variability Gauge", OutlineBox, {Set Title( "" )} ),
				Dispatch( {parseName}, "2", ScaleBox( 2 ), {Format( "Fixed Dec", 4, 0 ), Min( 0 )} ),
				Dispatch( {parseName}, "Group Means", StringColBox, {Visibility( "Collapse" )} ),
				Dispatch( {parseName}, "", PlotColBox, {Visibility( "Collapse" )} )
			)
		)
	);
);
- Mark as New
- Bookmark
- Subscribe
- Mute
- Subscribe to RSS Feed
- Get Direct Link
- Report Inappropriate Content
Re: Nested/Multiple Data Filter Context Box
- Mark as New
- Bookmark
- Subscribe
- Mute
- Subscribe to RSS Feed
- Get Direct Link
- Report Inappropriate Content
Re: Nested/Multiple Data Filter Context Box
In Jim's examples, the Data Filter Source Box is exactly what is needed to use one JMP graph to filter another. I did not see a Data Filter Source Box in your original script - I think the main issue was the use of the Where() clause (subset table) with a filter on the parent table.
The Data Filter Source Box is only need to use a platform as a filter, because unlike the built-in Data Filter object we cannot infer what the filter behavior should be.
- « Previous
-
- 1
- 2
- Next »
Recommended Articles
- © 2026 JMP Statistical Discovery LLC. All Rights Reserved.
- Terms of Use
- Privacy Statement
- Contact Us

