- JMP Statement Regarding Critical PHP Remote Code Execution Vulnerabilities (CVE-2026-109618, CVE-2026-109619)
- Don’t miss your chance to experience Discovery Summit Europe at our best available rate! Early bird registration through 31 Oct.
- Graph Builder Toolbar streamlines interactive graphing. Creates shortcuts on Report and GraphBuilder Helpers toolbars. Download and install the extension.
- Subscribe to RSS Feed
- Mark Topic as New
- Mark Topic as Read
- Float this Topic for Current User
- Bookmark
- Subscribe
- Mute
- Printer Friendly Page
Discussions
Solve problems, and share tips and tricks with other JMP users.- User Community
- :
- Discussions
- :
- Multivariate Process Monitoring with MDMVCC

- Mark as New
- Bookmark
- Subscribe
- Mute
- Subscribe to RSS Feed
- Get Direct Link
- Report Inappropriate Content
Multivariate Process Monitoring with MDMVCC
hi, I have been using the Model Drive Multivariate Control Charts for my process monitoring for a few months and there are a few questions / issues I would like to check if anyone has encountered similar, any solution available
1. Very often the model is sensitive to deviations from the baseline but still within normal operating range and is flagged up in the T2 plot. It would be great if a weightage can be assigned to variables or even better the normal operating range can be defined and considered in the model - hopefully reducing sensitivity and the T2 / DModX values. I think this is currently not available on JMP but other software?
2. The specification limits defined for variables in column property have no effect on the red/green depiction for univariate within/out of control. It seems the within/out of control shown in the contribution plot is solely based on the variance in the dataset - again, it would be useful to understand performance with respect to limits. Is there a way to utilize MDMVCC which also consider specification limits?
3. Any missing data will render the row useless in MDMVCC so I usually start with Automatic Data Imputation to fill in missing values. This will create a separate data table without all the scripts and labels in my original data table, I then need to copy over the changes. Alternatively I perform the imputation on the new data before joining to my original data table. Nonetheless, I am not able to tell which data points are imputed as they are not distinguished from actual data points once I combine the tables. Is there a better way to do this?
Thanks for taking the time to read through my post!
Cheers,
yb


- Mark as New
- Bookmark
- Subscribe
- Mute
- Subscribe to RSS Feed
- Get Direct Link
- Report Inappropriate Content
Re: Multivariate Process Monitoring with MDMVCC
1. I assume that the "model" is multivariate, but the "normal operating range" is univariate. The point of the T square chart is that individual univariate charts will not signal a change when the observation breaks the established correlation. Are you sure you want to reduce the sensitivity of the T square chart?
2. Capability (within specification limits) depends on control (within control limits) but not the other way around. As you say, control is based on the inherent or natural variation of the process, not on the performance against goals.
3. Imputation will produce expected data and reduce the chart's sensitivity. Why is data missing? How frequently are data missing?
- Mark as New
- Bookmark
- Subscribe
- Mute
- Subscribe to RSS Feed
- Get Direct Link
- Report Inappropriate Content
Re: Multivariate Process Monitoring with MDMVCC
Thank you for the reply Mark.
Yes the normal operating range I am referring to univariate.
And the flexibility to reduce/adjust sensitivity to certain parameters, taking into considerations user defined normal range could be helpful.
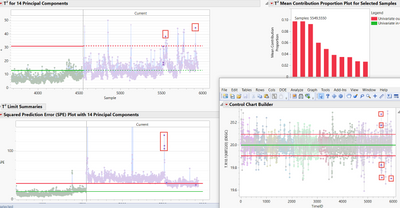
- I attach one example where the T square chart and SPE chart showed a few deviations where the top contributor was a temperature that was controlling well except for occasional fluctuations +- 0.2 to 0.3, if I am not very interested to know when the process temperature is within 0.3 from the set point I would like to reduce the sensitivity of the model accordingly which could help me pick up other variables better
My 2nd question is related to the 1st one, in that whether can we influence the red/green depiction for within/out of control by column property specification of control limits or specification limits.
Data missing occurs time to time but not very often and usually just a few out of a hundred variables. I would like to know if there is a better way to integrate the data preparation step (handling missing data) with the multivariate monitoring process so that it is efficient.
- Mark as New
- Bookmark
- Subscribe
- Mute
- Subscribe to RSS Feed
- Get Direct Link
- Report Inappropriate Content
Re: Multivariate Process Monitoring with MDMVCC
Both T square and SPE appear substantionally elevated in the Current phase, so it is not surprising that you will encounter more signals now.
You might be satisfied with the current control of the process temperature. Still, T square indicates that the change in this temperature is no longer correlated with the change in other variables. A control chart tells you when an unusual or unexpected event happened. It is not necessarily bad. What was the correlation structure of the 14 variables that are included in this chart? Has it changed during the Current phase?
I do not know of a method for reducing a variable's sensitivity in the T square calculation. Another reader might suggest a way.
What if you remove the process temperature from T square, since you do not consider it important if the univariate chart indicates that it is in control?
I do not know of a way to impute missing data that would not compromise T square.
Recommended Articles
- © 2026 JMP Statistical Discovery LLC. All Rights Reserved.
- Terms of Use
- Privacy Statement
- Contact Us