Hello everyone:
I recently started learning JMP and its great! However, I am having trouble with analyzing one of my data set. It was set up as a Split Plot Design. Can anyone provide me some insight if I am in the right direction?
I have 4 fertilizer treatments (character nominal) as my main plot, each fertilizer treatment is split with 3 rates - low, medium, and high (subplots) and each treatment were replicated four times (blocks). Hence I have a total of 4 treatments X 3 rates X 4 replicates= 48 plots. Furthermore, I have two years of data - 2018 and 2019. I am evaluating the impacts of fertilizer applications on plant yield
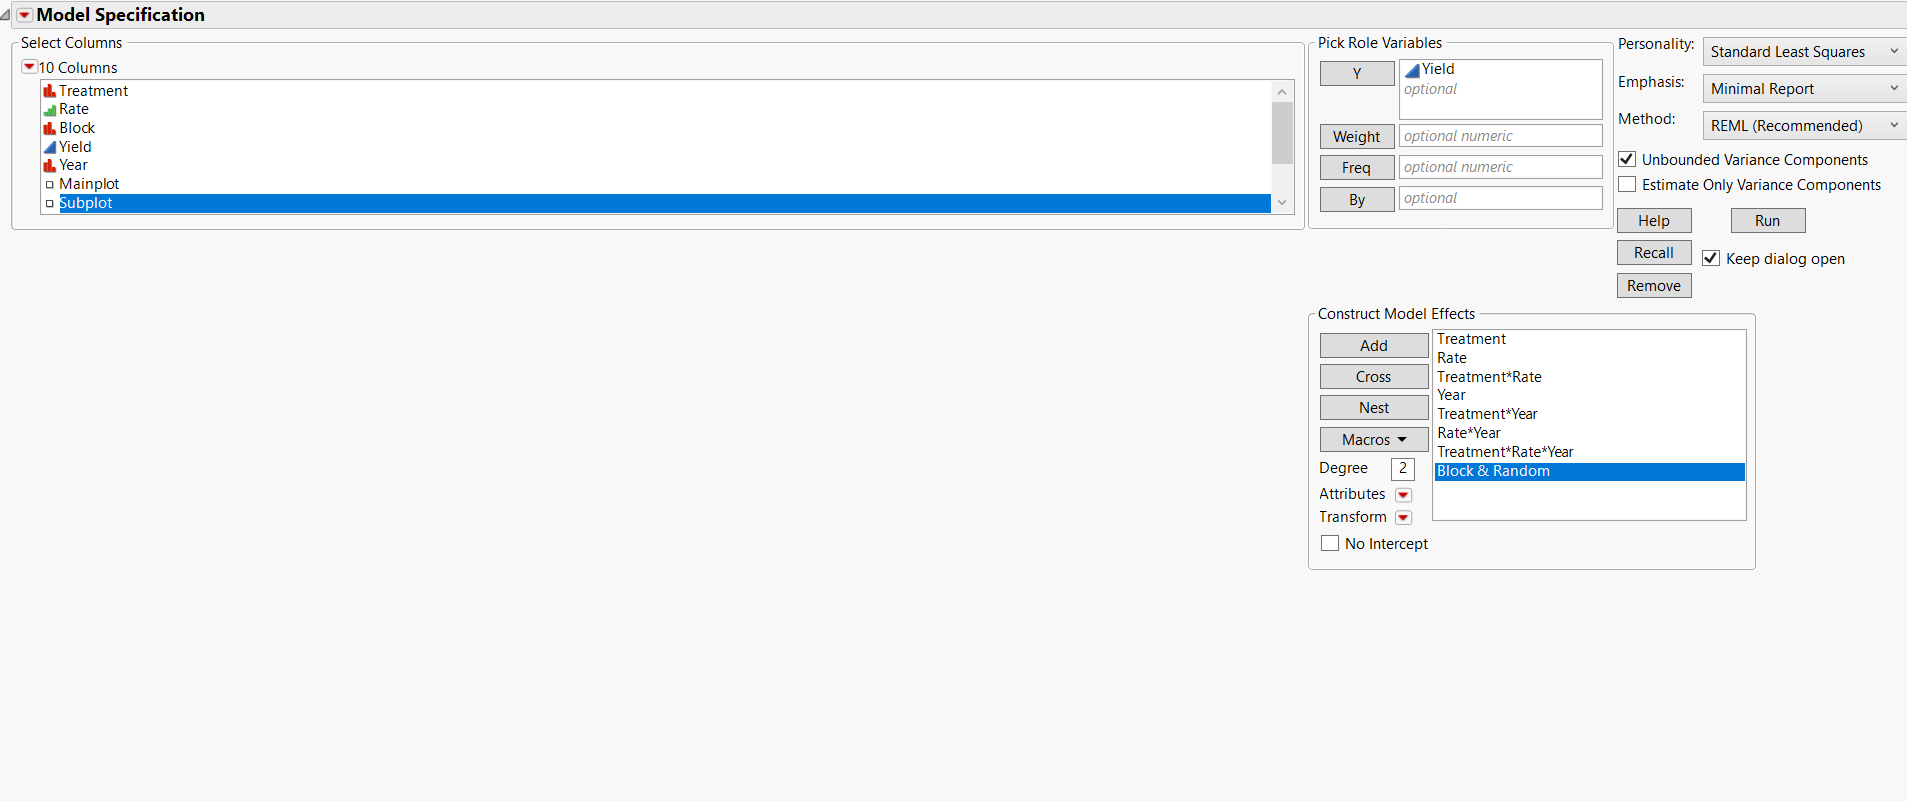
I am considering my fertilizer treatments, rates, and year as fixed effects, whereas, I am treating blocks as my random effect. I am not sure if I am doing it correctly or not. Any help will be appreciated!
I treated fertilizer treatments, year, and block as - Character; nominal. Rate as Character; ordinal and yield (numeric; continuous).
I am also attaching a screenshot with my message. Again, any help will be appreciated!
Thank you!
