- Learn how to build custom Python data connectors and further customize JMP’s Data Connector Framework with the Python Data Connector Demo, available now in the JMP Marketplace!
- See how to create experiments to support product design and ID useful product features. Register for June 12 webinar, 2pm US Eastern Time.
- Subscribe to RSS Feed
- Mark Topic as New
- Mark Topic as Read
- Float this Topic for Current User
- Bookmark
- Subscribe
- Mute
- Printer Friendly Page
Discussions
Solve problems, and share tips and tricks with other JMP users.- JMP User Community
- :
- Discussions
- :
- Multiple Regression in Split Plot Design

- Mark as New
- Bookmark
- Subscribe
- Mute
- Subscribe to RSS Feed
- Get Direct Link
- Report Inappropriate Content
Multiple Regression in Split Plot Design
Hello everyone:
I recently started learning JMP and its great! However, I am having trouble with analyzing one of my data set. It was set up as a Split Plot Design. Can anyone provide me some insight if I am in the right direction?
I have 4 fertilizer treatments (character nominal) as my main plot, each fertilizer treatment is split with 3 rates - low, medium, and high (subplots) and each treatment were replicated four times (blocks). Hence I have a total of 4 treatments X 3 rates X 4 replicates= 48 plots. Furthermore, I have two years of data - 2018 and 2019. I am evaluating the impacts of fertilizer applications on plant yield
I am considering my fertilizer treatments, rates, and year as fixed effects, whereas, I am treating blocks as my random effect. I am not sure if I am doing it correctly or not. Any help will be appreciated!
I treated fertilizer treatments, year, and block as - Character; nominal. Rate as Character; ordinal and yield (numeric; continuous).
I am also attaching a screenshot with my message. Again, any help will be appreciated!
Thank you!
Accepted Solutions

- Mark as New
- Bookmark
- Subscribe
- Mute
- Subscribe to RSS Feed
- Get Direct Link
- Report Inappropriate Content
Re: Multiple Regression in Split Plot Design
I think that the analysis I showed (and saved as the Model table script) is the best way forward. The model captures the fixed and random effects based on the factor levels and randomization. I just wanted you to know that the zeroed estimate of the whole plot variance is not a mistake or artifact. The data simply is insufficient. Running five rows (in the future) would alleviate that deficiency for you.
- Mark as New
- Bookmark
- Subscribe
- Mute
- Subscribe to RSS Feed
- Get Direct Link
- Report Inappropriate Content
Re: Multiple Regression in Split Plot Design
You are using some terms in a way that makes your design and analysis unclear.
A split-plot design involves hard-to-change factors. These factors are randomized less often than easy-to-change factors. Randomization means both the random order of the treatments (fertilizer, rate) and the levels are reset for each run. What is your hard-to-change factor?
I am going to use the term 'fertilizer' for the first factor. We use the term 'treatment' to mean the combination of all the factor levels in a given run. For example, a treatment might be fertilizer = A and rate = low.
We use the term 'block' to refer to groups of runs that represent either a fixed or a random effect of an external factor. For example, it might be day, batch, and so on. How were your runs blocked?
We use the term 'replication' to mean that a give treatment was used more than once in the design. This feature is used to estimate the error in a way that is independent of the model. How did you replicate runs?
The analysis much match the experiment, so it is not possible to say if your model is appropriate until we know more about the factors, the design, and the execution of the experiment.
- Mark as New
- Bookmark
- Subscribe
- Mute
- Subscribe to RSS Feed
- Get Direct Link
- Report Inappropriate Content
Re: Multiple Regression in Split Plot Design
Hey Mark! Thank you so much for your help. I really appreciate it.
I am afraid I won't be able to explain my design eloquently with proper terminology. Therefore, I am attaching my design map with this message. I hope it'll be helpful for you to understand. Please note that I have color coded the plots. The denser color represents high rate and lighter color represents low rate and I have 4 fertilizers represented as orange, yellow, green and red.
Again, thank you so much for helping me out. Eagerly waiting to hear back from you.
Amit Bhasin
- Mark as New
- Bookmark
- Subscribe
- Mute
- Subscribe to RSS Feed
- Get Direct Link
- Report Inappropriate Content
Re: Multiple Regression in Split Plot Design
From the map alone, this experiment appears to be a balanced complete block design. I don't see the split-plot structure or the presence of whole and split plots. It appears to be a fully randomized experiment, although you might not have run it that way. I just can't tell.
What is the definition of a block in your experiment? For example, each block is one growing season and you replicated all the runs for four seasons? Perhaps a block is one field and you replicated the entire design in four fields?
- Mark as New
- Bookmark
- Subscribe
- Mute
- Subscribe to RSS Feed
- Get Direct Link
- Report Inappropriate Content
Re: Multiple Regression in Split Plot Design
Hello Mark,
Thank you so much for taking a look at my map. I'll try to explain my design here. Blocks are different rows within a field, so I have four rows in my experiment. I was considering one fertilizer material as my whole plot. And my rate (high, medium, and low) was spilt within fertilizer material.
Amit
- Mark as New
- Bookmark
- Subscribe
- Mute
- Subscribe to RSS Feed
- Get Direct Link
- Report Inappropriate Content
Re: Multiple Regression in Split Plot Design
This description really helps clarify the design and how you ran the experiment. I had to use these steps to create the design that you described:
- Define Fertilizer as a hard-to-change categorical factor with four levels.
- Define Rate as an easy-to-change categorical factor with three levels.
- Define Field Row as a very-hard-to-change categorical factor with four levels. Defining Field Row as a blocking factor with 12 runs does not maintain the order that you described in each row.
- I added a two-factor interaction between Fertilizer and Rate to the model. It is likely that the effect of changing the Rate is not the same for all Fertilizers.
- I requested 4 whole plots (4 rows in the field). This is not enough to estimate the whole plot variance, though. Do you expect this source of variation to be large?
- I requested 16 sub-plots, 4 per row. This is for Fertilizer.
- I requested 48 runs.
This design provides high power (0.89 to 1) if the important effects are at least four times the response standard deviation.
I saved the design as a data table for your review. Unfortunately, I cannot match the ordering in your design but you should be able to identify the rows yourself. The Model script will perform the correct analysis, but it must zero the whole plot variance (insufficient whole plots to estimate this effect). The DOE Dialog script will re-create the custom design platform so you can see what I did.
Let me know if you have any further questions.
- Mark as New
- Bookmark
- Subscribe
- Mute
- Subscribe to RSS Feed
- Get Direct Link
- Report Inappropriate Content
Re: Multiple Regression in Split Plot Design
Hey Mark!
Thank you so much for your help! I reallly appreciate it.
Mark, the whole plot variance is large. I am able to understand the design you created, but unfortunately I have never used DOE part in JMP so I am not sure how to use this to run my analysis. Is there any video source which I can watch?
I conducted this experiment for two years and will eventually like to see if there is any year effect or not. Additonally, I harvested three plants under each subplot. Should I simply add a column next to subplot section?
Again, thanks for your help.
- Mark as New
- Bookmark
- Subscribe
- Mute
- Subscribe to RSS Feed
- Get Direct Link
- Report Inappropriate Content
Re: Multiple Regression in Split Plot Design
Unfortunately, this design does not support the estimation of the variance between field rows. The change in whole plot is confounded with other fixed effects. I believe that this model realistically captures the potential effects and the randomization in your experiment:

I simulated the response with a single standard normal population (no effects) so I could demonstrate the problem with the analysis:

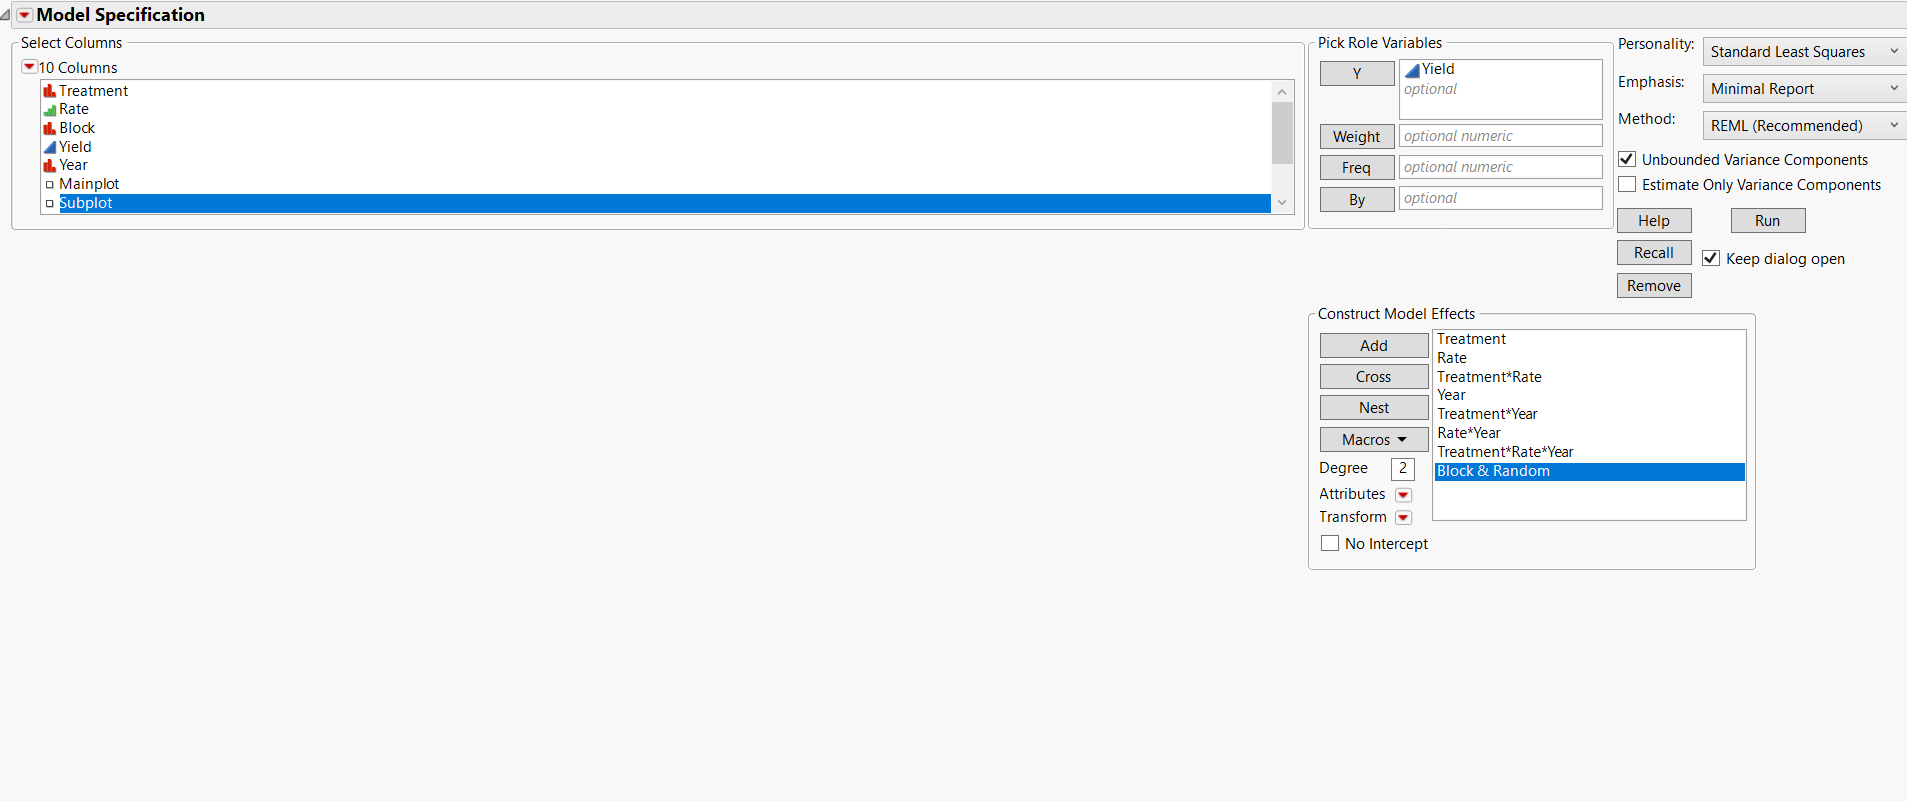
You can see that the whole plot effects are zerod because of the confounding. You need at least one more whole plot (field row) to make it work.
- Mark as New
- Bookmark
- Subscribe
- Mute
- Subscribe to RSS Feed
- Get Direct Link
- Report Inappropriate Content
Re: Multiple Regression in Split Plot Design
Thank you, Mark. I can see the plot effects coming to be zero. Based on this result, what are my options to move forward with the analysis?
Amit
- Mark as New
- Bookmark
- Subscribe
- Mute
- Subscribe to RSS Feed
- Get Direct Link
- Report Inappropriate Content
Re: Multiple Regression in Split Plot Design
I think that the analysis I showed (and saved as the Model table script) is the best way forward. The model captures the fixed and random effects based on the factor levels and randomization. I just wanted you to know that the zeroed estimate of the whole plot variance is not a mistake or artifact. The data simply is insufficient. Running five rows (in the future) would alleviate that deficiency for you.
Recommended Articles
- © 2026 JMP Statistical Discovery LLC. All Rights Reserved.
- Terms of Use
- Privacy Statement
- Contact Us