Turn on suggestions
Auto-suggest helps you quickly narrow down your search results by suggesting possible matches as you type.
- Learn how to build custom Python data connectors and further customize JMP’s Data Connector Framework with the Python Data Connector Demo, available now in the JMP Marketplace!
- See how to move from signal modeling to system modeling at the first JMP Aerospace Analytics webinar. Register. June 18, 1 p.m. US Eastern Time.
Options
- Subscribe to RSS Feed
- Mark Topic as New
- Mark Topic as Read
- Float this Topic for Current User
- Bookmark
- Subscribe
- Mute
- Printer Friendly Page
Discussions
Solve problems, and share tips and tricks with other JMP users.- JMP User Community
- :
- Discussions
- :
- Missing Y-Axis on Normal Quantile Plot
Level VI
- Mark as New
- Bookmark
- Subscribe
- Mute
- Subscribe to RSS Feed
- Get Direct Link
- Report Inappropriate Content
Missing Y-Axis on Normal Quantile Plot
Created:
May 4, 2026 09:12 PM
| Last Modified: May 4, 2026 6:14 PM
(625 views)
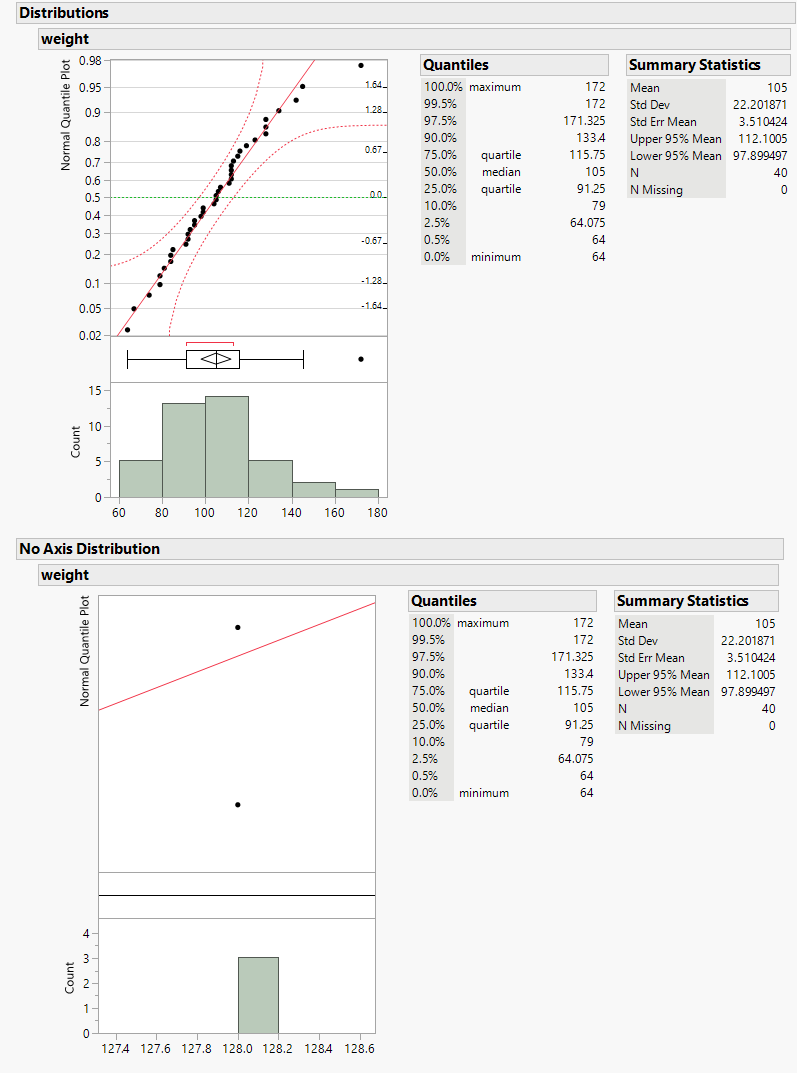
When I zoom into a Distribution Normal Quantile Plot, the y-axis will disappear. This makes it difficult to determine the exact quantile of a value. Is this a bug?
I am using JMP 19.1.0, Windows 11 Pro 25H2.
Names Default To Here( 1 );

dt = Open( "$SAMPLE_DATA/Big Class.jmp" );

// Normal vertical axis on Normal Quantile Plot.
dt << Distribution(
	Continuous Distribution(
		Column( :weight ),
		Horizontal Layout( 1 ),
		Vertical( 0 ),
		Count Axis( 1 ),
		Axes on Left( 1 ),
		Process Capability( 0 ),
		Normal Quantile Plot( 1 )
	)
);

// Vertical axis on Normal Quantile Plot is not displayed.
dt << Distribution(
	Continuous Distribution(
		Column( :weight ),
		Horizontal Layout( 1 ),
		Vertical( 0 ),
		Count Axis( 1 ),
		Axes on Left( 1 ),
		Process Capability( 0 ),
		Normal Quantile Plot( 1 )
	),
	SendToReport(
		Dispatch( {}, "Distributions", OutlineBox, {Set Title( "No Axis Distribution" )} ),
		Dispatch( {"weight"}, "1", ScaleBox, {Format( "Fixed Dec", 12, 1 ), Min( 127.313361687689 ), Max( 128.674638157731 ), Inc( 0.2 )} ),
		Dispatch( {"weight"}, "5", ScaleBox, {Min( 0.819361880370155 ), Max( 0.857836194033201 )} )
	)
);
1 ACCEPTED SOLUTION
Accepted Solutions

Super User
Solution
- Mark as New
- Bookmark
- Subscribe
- Mute
- Subscribe to RSS Feed
- Get Direct Link
- Report Inappropriate Content
Re: Missing Y-Axis on Normal Quantile Plot
Seems to be issue with probability scales where if you "zoom" between two ticks the axis basically disappears (maybe because there isn't increment option). I would contact JMP support
-Jarmo
2 REPLIES 2
Level VI
- Mark as New
- Bookmark
- Subscribe
- Mute
- Subscribe to RSS Feed
- Get Direct Link
- Report Inappropriate Content
Re: Missing Y-Axis on Normal Quantile Plot
Super User
Solution
- Mark as New
- Bookmark
- Subscribe
- Mute
- Subscribe to RSS Feed
- Get Direct Link
- Report Inappropriate Content
Re: Missing Y-Axis on Normal Quantile Plot
Seems to be issue with probability scales where if you "zoom" between two ticks the axis basically disappears (maybe because there isn't increment option). I would contact JMP support
-Jarmo
Recommended Articles
- © 2026 JMP Statistical Discovery LLC. All Rights Reserved.
- Terms of Use
- Privacy Statement
- Contact Us