- We’re retiring the File Exchange at the end of this year. The JMP Marketplace is now your destination for add-ins and extensions.
- JMP 19 is here! Learn more about the new features.
- Subscribe to RSS Feed
- Mark Topic as New
- Mark Topic as Read
- Float this Topic for Current User
- Bookmark
- Subscribe
- Mute
- Printer Friendly Page
Discussions
Solve problems, and share tips and tricks with other JMP users.- JMP User Community
- :
- Discussions
- :
- Re: Matched Pair Analysis
- Mark as New
- Bookmark
- Subscribe
- Mute
- Subscribe to RSS Feed
- Get Direct Link
- Report Inappropriate Content
Matched Pair Analysis
Hello,
How can I customize the confidence interval for a matched pair analysis output? The default is a 95% upper and lower limit that but I'd like to use some standard deviation based on the data. Can you show me how to do this?
Thanks,
Naeem
- Tags:
- windows
- Mark as New
- Bookmark
- Subscribe
- Mute
- Subscribe to RSS Feed
- Get Direct Link
- Report Inappropriate Content
Re: Matched Pair Analysis
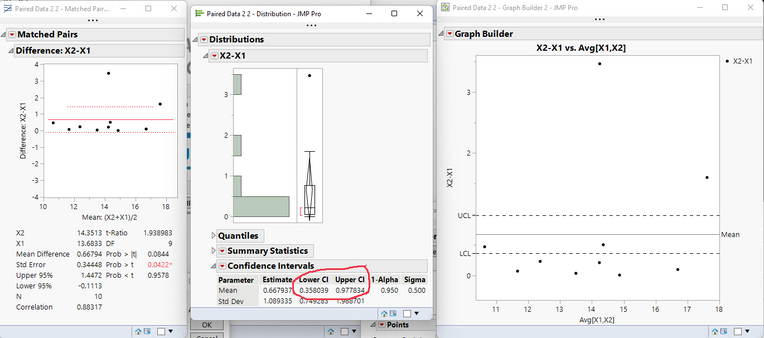
There isn't a way to do it inside the Matched Pairs platform, but you can recreate the analysis with some new formula columns in the table (the graph in matched pairs tells you what the formulas need to be), then do whichever further analysis you need on those new columns. For example, if all you want is a graph with different confidence intervals, then you can use the Distribution platform and ask for a custom interval, then use the Graph Builder to make the new graph with those custom intervals. I've attached a sample data table with scripts saved to it.
- Mark as New
- Bookmark
- Subscribe
- Mute
- Subscribe to RSS Feed
- Get Direct Link
- Report Inappropriate Content
Re: Matched Pair Analysis
EDIT: @julian's advice makes what I've suggested below obsolete. Not sure how my eyes have never caught that Matched Pairs has the Set Alpha Level option as well. Ignore the rest of this post!
-----
Kudos to Jed's solution for creating the mean difference graph with custom confidence limits. If you're not strictly tied to the specific output of Matched Pairs, I'll add that you can do a paired t-test in Fit Y by X, too, and there you can specify different confidence intervals without needing to go out to Distribution or elsewhere. (But you'll still need Jed's method for creating the mean difference graph if that's what you're after.)
First get your data into tall format as required by Fit Y by X. Starting with your data in wide format (required by Matched Pairs), add a column with a unique ID for each row to specify your blocks, then use Tables > Stack to get to tall format. In Fit Y by X, enter your blocking variable into the Block role in the launch dialog. Click OK, then select Means/ANOVA/Pooled t from the red triangle, and you'll get the same paired t-test you get in Matched Pairs. You can change the alpha level under the red triangle, and the confidence intervals in the report will update.
I've attached a version of Jed's data set in tall format, with a table script that runs the paired t-test in Fit Y by X and uses 90% confidence intervals.
JMP Academic Ambassador
- Mark as New
- Bookmark
- Subscribe
- Mute
- Subscribe to RSS Feed
- Get Direct Link
- Report Inappropriate Content
Re: Matched Pair Analysis
Hi @ndowidar,
In the Matched Pairs platform (Analyze > Specialized Modeling > Matched Pairs), you can change the confidence level for the confidence intervals by changing the the alpha level.
To do this, click the Red Triangle, go to "Set α level," and then pick the alpha level that corresponds to your desired confidence level. For example, if you wish to form 90% confidence intervals, that's equivalent to an alpha level of 0.10 (confidence level = 1 - alpha level).
In the image below I have changed the alpha value and you can see 90% confidence intervals are being reported. The confidence limits about the mean difference in the difference plot are also updated to match this level of confidence.
I hope this helps!
- Mark as New
- Bookmark
- Subscribe
- Mute
- Subscribe to RSS Feed
- Get Direct Link
- Report Inappropriate Content
Re: Matched Pair Analysis
@ndowidar what do you mean by "but I'd like to use some standard deviation based on the data" ?
Recommended Articles
- © 2025 JMP Statistical Discovery LLC. All Rights Reserved.
- Terms of Use
- Privacy Statement
- Contact Us


