- Instantly extract effect sizes, F-ratios, and FDR-adjusted p-values from your models with the Calculate Effects Sizes extension, available now in the JMP Marketplace!
- New to JMP? Join us Sept. 23-24 for the Early User Edition of Discovery Summit, tailor-made for new users. Register now for free!
- Your voice matters! Tell us how you prefer to receive JMP updates, so we can tailor our communication to your needs. Take short survey.
- Subscribe to RSS Feed
- Mark Topic as New
- Mark Topic as Read
- Float this Topic for Current User
- Bookmark
- Subscribe
- Mute
- Printer Friendly Page
Discussions
Solve problems, and share tips and tricks with other JMP users.- JMP User Community
- :
- Discussions
- :
- Re: Make histogram and box plot in graph builder

- Mark as New
- Bookmark
- Subscribe
- Mute
- Subscribe to RSS Feed
- Get Direct Link
- Report Inappropriate Content
Make histogram and box plot in graph builder
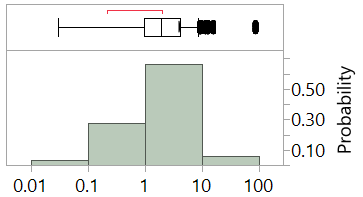
In the distribution platform you can add a box plot to the histogram (attached pic 1). 
How can I make a similar plot in Graph Builder? The reason that I am asking is I want to overlay it with a categorical parameter.
I made those plots separately and attached them manually in Photoshop (see attached pic2).

If such thing can be done much easier and faster in Graph Builder, which is usually done with a dummy variable, please let me know (preferably without JSL coding!!)

- Mark as New
- Bookmark
- Subscribe
- Mute
- Subscribe to RSS Feed
- Get Direct Link
- Report Inappropriate Content
Re: Make histogram and box plot in graph builder
I don't know of an interactive way to do what you want in one instance of Graph Builder, but below is the "Start" of a simple script that may get you what you want.

names default to here(1);
dt=open("$SAMPLE_DATA/big class.jmp");

his = dt << Graph Builder(
	Size( 534, 456 ),
	Show Control Panel( 0 ),
	Variables( X( :height ), Overlay( :sex ) ),
	Elements( Points( X, Legend( 2 ) ), Histogram( X, Legend( 3 ) ) ),
	SendToReport(
		Dispatch( {}, "graph title", TextEditBox, {Set Text( "" )} ),
		Dispatch(
			{},
			"Graph Builder",
			FrameBox,
			{DispatchSeg( Hist Seg( 1 ), Bin Span( 24, 0 ) ),
			DispatchSeg( Hist Seg( 2 ), Bin Span( 24, 0 ) )}
		)
	)
);

box = dt << Graph Builder(
	Size( 495, 296 ),
	Show Control Panel( 0 ),
	Variables( X( :height ), Overlay( :sex ), Color( :sex ) ),
	Elements( Box Plot( X, Legend( 5 ) ) ),
	SendToReport(
		Dispatch(
			{},
			"Graph Builder",
			FrameBox,
			{DispatchSeg(
				Box Plot Seg( "Box Plot (F)" ),
				{Line Color( "Medium Dark Blue" ), Fill Color( "Medium Dark Blue" ),
				Fill( 1 )}
			), DispatchSeg(
				Box Plot Seg( "Box Plot (M)" ),
				{Line Color( "Medium Dark Red" ), Fill Color( "Medium Light Red" ),
				Fill( 1 )}
			)}
		)
	)
);

new window("Height", lub = lineupbox(n col(1)));
lub<<append(report(box)[FrameBox(1)]);
lub<<append(report(his)[Frame box(1)]);
lub<<append(report(his)[AxisBox(1)]);
- Mark as New
- Bookmark
- Subscribe
- Mute
- Subscribe to RSS Feed
- Get Direct Link
- Report Inappropriate Content
Re: Make histogram and box plot in graph builder
Jim provided you with what you wanted. Below is an alternative view.
I am not a fan of vertical histograms, but you can create the view below fairly easily. The script follows. This is more of an FYI and to determine if the developers might know of a clever method to rotate the frame or create a layout for what you want directly with GraphBuilder.

names default to here(1);
dt=open("$SAMPLE_DATA/big class.jmp");

//Gender is a numeric column
dt << New Column( "Gender",
		Numeric,
		"Continuous",
		Format( "Best", 12 ),
		Formula( If( :sex == "F", 1, 2 ) ),
		Value Labels( {1 = "F", 2 = "M"} ),
		Use Value Labels( 1 )
	);
//Counts is a constant column used a placed holder
dt << New Column( "Counts",
		Numeric,
		"Continuous",
		Format( "Best", 12 ),
		<< set Each Value(1)
);

gb = dt <<Graph Builder(
	Size( 526, 454 ),
	Show Control Panel( 0 ),
	Variables(
		X( :Counts ),
		X( :Gender ),
		Y( :height ),
		Overlay( :sex ),
		Color( :sex )
	),
	Elements( Position( 1, 1 ), Histogram( X, Y, Legend( 41 ) ) ),
	Elements( Position( 2, 1 ), Box Plot( X, Y, Legend( 40 ) ) ),
	SendToReport(
		Dispatch(
			{},
			"Gender",
			ScaleBox,
			{Format( "Fixed Dec", 12, 0 ), Min( 0 ), Max( 2.5 ), Inc( 1 ),
			Minor Ticks( 0 )}
		),
		Dispatch(
			{},
			"Y title",
			TextEditBox,
			{Rotate Text( "Right" ), Set Font Size( 12 ), Set Font Style( "Bold" )}
		),
		Dispatch(
			{},
			"Graph Builder",
			FrameBox( 2 ),
			{DispatchSeg(
				Box Plot Seg( "Box Plot (F, 1)" ),
				{Line Width( 2 ), Fill Color( {66, 112, 221} ), Fill( 1 ),
				Transparency( 0.6 )}
			), DispatchSeg(
				Box Plot Seg( "Box Plot (M, 2)" ),
				{Line Width( 2 ), Fill Color( {212, 73, 88} ), Fill( 1 ),
				Transparency( 0.6 )}
			)}
		),
		Dispatch(
			{},
			"400",
			LegendBox,
			{Legend Position( {41, [0, 1], 40, [-1, -1, -1, -1, -3, -3]} ),
			Position( {0, 1, -1, -1, -1, -1, -3, -3} )}
		)
	)
);
- Mark as New
- Bookmark
- Subscribe
- Mute
- Subscribe to RSS Feed
- Get Direct Link
- Report Inappropriate Content
Re: Make histogram and box plot in graph builder
Recommended Articles
- © 2026 JMP Statistical Discovery LLC. All Rights Reserved.
- Terms of Use
- Privacy Statement
- Contact Us