Turn on suggestions
Auto-suggest helps you quickly narrow down your search results by suggesting possible matches as you type.
Options
- Subscribe to RSS Feed
- Mark Topic as New
- Mark Topic as Read
- Float this Topic for Current User
- Bookmark
- Subscribe
- Mute
- Printer Friendly Page
Discussions
Solve problems, and share tips and tricks with other JMP users.- JMP User Community
- :
- Discussions
- :
- JSL user defines row legend color
- Mark as New
- Bookmark
- Subscribe
- Mute
- Subscribe to RSS Feed
- Get Direct Link
- Report Inappropriate Content
JSL user defines row legend color
Created:
May 26, 2023 09:22 PM
| Last Modified: Jun 9, 2023 9:10 AM
(1666 views)
appreciated if someone can share the knowledge to define and assign row legend color.
take Cheese.jmp dataset example, if it is possible to assign row cheese A = pink color, cheese B= black color by using JMP 14.
Bivariate(
	Y( :Score ),
	X( :Count ),
	SendToReport(
		Dispatch(
			{},
			"Bivar Plot",
			FrameBox,
			{Row Legend(
				Cheese,
				Color( 1 ),
				Color Theme( "JMP Default" ),
				Marker( 0 ),
				Marker Theme( "" ),
				Continuous Scale( 0 ),
				Reverse Scale( 0 ),
				Excluded Rows( 0 )
			)}
		)
	)
);
3 REPLIES 3
- Mark as New
- Bookmark
- Subscribe
- Mute
- Subscribe to RSS Feed
- Get Direct Link
- Report Inappropriate Content
Re: JSL user defines row legend color
Created:
May 27, 2023 06:47 AM
| Last Modified: May 27, 2023 4:17 AM
(1646 views)
| Posted in reply to message from CDW 05-26-2023
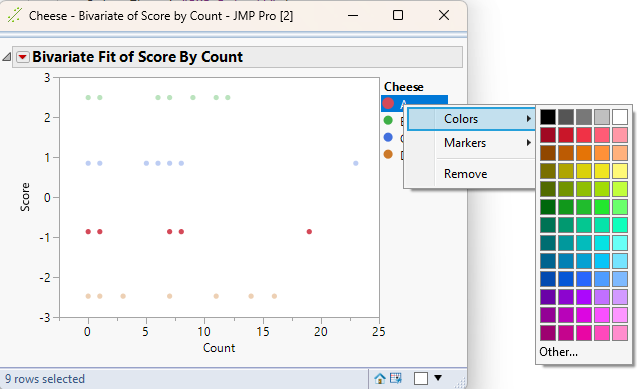
You can right click on the Legend grouping and select the color you want the row values to change to
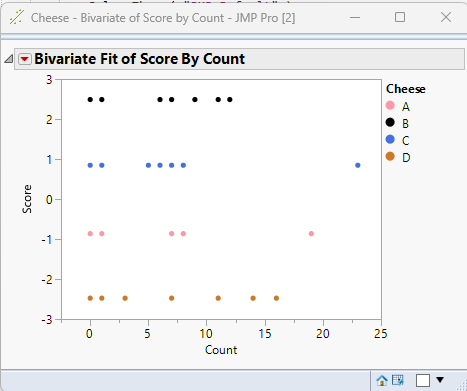
Here is the chart with the A Cheese set to pint, and the B Cheese set to black
How I would do this in JSL would be:
Names Default To Here( 1 );
dt = Current Data Table();

For Each Row(
	If(
		:cheese == "A", theColor = "light red",
		:cheese == "B", theColor = "Black",
		:cheese == "C", theColor = "Orange",
		theColor = "Green"
	);
	Row State( Row() ) = Color State( thecolor );
);

Bivariate(
	Y( :Score ),
	X( :Count )
);
Jim
- Mark as New
- Bookmark
- Subscribe
- Mute
- Subscribe to RSS Feed
- Get Direct Link
- Report Inappropriate Content
Re: JSL user defines row legend color
Another approach:
via Value Colors property of the column.
I hope it was available in Jmp14?
- Mark as New
- Bookmark
- Subscribe
- Mute
- Subscribe to RSS Feed
- Get Direct Link
- Report Inappropriate Content
Re: JSL user defines row legend color
Yes, Value Colors are available in JMP 14.
Jim
Recommended Articles
- © 2026 JMP Statistical Discovery LLC. All Rights Reserved.
- Terms of Use
- Privacy Statement
- Contact Us


