- Don’t miss your chance to experience Discovery Summit Europe at our best available rate! Early bird registration through 31 Oct.
- Graph Builder Toolbar streamlines interactive graphing. Creates shortcuts on Report and GraphBuilder Helpers toolbars. Download and install the extension.
- Subscribe to RSS Feed
- Mark Topic as New
- Mark Topic as Read
- Float this Topic for Current User
- Bookmark
- Subscribe
- Mute
- Printer Friendly Page
Discussions
Solve problems, and share tips and tricks with other JMP users.- User Community
- :
- Discussions
- :
- JSL - showing spec limits as graph reference lines

- Mark as New
- Bookmark
- Subscribe
- Mute
- Subscribe to RSS Feed
- Get Direct Link
- Report Inappropriate Content
JSL - showing spec limits as graph reference lines
Hi, thanks for reading this.
When viewing a column's spec limits in column properties, there is a check box that enables the display of those spec limits in certain platforms.
I'm trying to figure out a way to show the limits with "Show Limits (1)."
With pre-selected columns, I'm working on the following script:
dt = Open();
dtcols = dt << Get Selected Columns;
addprop = Expr(
For(i = 1, i <= NItems(dtcols), i++,
// Column(dt, Char(dtcols))<< Set Property( "Spec Limits", {Show Limits( 1 )} ); //setting the SL property erases the current values, enabling the check box but the spec limits are lost. So:
specs = Column(dt, Char(dtcols)) << Get Property( "Spec Limits" ); //create a copy of the spec limits already in the table,
// Insert Into(specs, Show Limits(1)); //and somehow add "Show Limits(1)" to the spec limits in "specs", but "specs" is a name and not a list
Column(dt, Char(dtcols)) << Set Property( "Spec Limits" , {Eval(specs)} );
)
);
addprop;
Any ideas or suggestions will be much appreciated.
Evan
Accepted Solutions
- Mark as New
- Bookmark
- Subscribe
- Mute
- Subscribe to RSS Feed
- Get Direct Link
- Report Inappropriate Content
Re: JSL - showing spec limits as graph reference lines
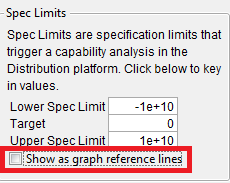
I had success uploading the spec limits directly to the column properties and including the Show Limits(1) argument. I had been importing the spec limits when running capability analysis, then trying to activate the "show as graph reference lines" check box in the column properties later which I could never get to work.


- Mark as New
- Bookmark
- Subscribe
- Mute
- Subscribe to RSS Feed
- Get Direct Link
- Report Inappropriate Content
Re: JSL - showing spec limits as graph reference lines
Evan,
The spec limits are displayed in the control chart builder.
dt=("$Sample_Data/New Heights.jmp");
dt<<Control Chart Builder(
Show Control Panel( 0 ),
Variables( Y( :height ) ),
Chart( Position( 1 ) ),
Chart( Position( 2 ) ),
SendToReport(
Dispatch(
{},
"height",
ScaleBox,
{Min( 41.255230125523 ), Max( 77.5 ), Inc( 5 ), Minor Ticks( 1 ),
Add Ref Line( 50, Solid, "Blue", "LSL" ),
Add Ref Line( 70, Solid, "Blue", "USL" )}
),
Dispatch( {}, "Control Chart Builder", FrameBox, {Marker Size( 2 )} ),
Dispatch( {}, "Control Chart Builder", FrameBox( 2 ), {Marker Size( 2 )} )
)
)
- Mark as New
- Bookmark
- Subscribe
- Mute
- Subscribe to RSS Feed
- Get Direct Link
- Report Inappropriate Content
Re: JSL - showing spec limits as graph reference lines
I had success uploading the spec limits directly to the column properties and including the Show Limits(1) argument. I had been importing the spec limits when running capability analysis, then trying to activate the "show as graph reference lines" check box in the column properties later which I could never get to work.

- Mark as New
- Bookmark
- Subscribe
- Mute
- Subscribe to RSS Feed
- Get Direct Link
- Report Inappropriate Content
Re: JSL - showing spec limits as graph reference lines
Would you mind sharing how you did it? This bug has been driving me insane. I need to not only enter the spec limits, but also see them when I display data to my team.

- Mark as New
- Bookmark
- Subscribe
- Mute
- Subscribe to RSS Feed
- Get Direct Link
- Report Inappropriate Content
Re: JSL - showing spec limits as graph reference lines
How'd you do that? Would you mind sending out the code? Does it work for JMP 12 too?
thank you
M

- Mark as New
- Bookmark
- Subscribe
- Mute
- Subscribe to RSS Feed
- Get Direct Link
- Report Inappropriate Content
Re: JSL - showing spec limits as graph reference lines
I would suggest taking a look at the following blog post.
Recommended Articles
- © 2026 JMP Statistical Discovery LLC. All Rights Reserved.
- Terms of Use
- Privacy Statement
- Contact Us