- Instantly extract effect sizes, F-ratios, and FDR-adjusted p-values from your models with the Calculate Effects Sizes extension, available now in the JMP Marketplace!
- New to JMP? Join us Sept. 23-24 for the Early User Edition of Discovery Summit, tailor-made for new users. Register now for free!
- Your voice matters! Tell us how you prefer to receive JMP updates, so we can tailor our communication to your needs. Take short survey.
- Subscribe to RSS Feed
- Mark Topic as New
- Mark Topic as Read
- Float this Topic for Current User
- Bookmark
- Subscribe
- Mute
- Printer Friendly Page
Discussions
Solve problems, and share tips and tricks with other JMP users.- JMP User Community
- :
- Discussions
- :
- Re: JSL help: Plot Bootstrap -feature imortance TOP 10 columns for graph builder

- Mark as New
- Bookmark
- Subscribe
- Mute
- Subscribe to RSS Feed
- Get Direct Link
- Report Inappropriate Content
JSL help: Plot Bootstrap -feature imortance TOP 10 columns for graph builder
Dear powerful JMP user,
I want to make an automation script using jsl to fulfill the function below:
Use bootstrap method for my dataset analysis, then plot the top 10 feature importance parameter for view, could you pls share me an sample for how to do that?
Regards
Anna
Accepted Solutions

- Mark as New
- Bookmark
- Subscribe
- Mute
- Subscribe to RSS Feed
- Get Direct Link
- Report Inappropriate Content
Re: JSL help: Plot Bootstrap -feature imortance TOP 10 columns for graph builder
Here is an example of one way to do this. I am not sure if it is capturing the top 10 the way you envision, but it should give you an idea of how to proceed.
Names Default To Here( 1 );

// Open Data Table: semiconductor capability.jmp
// → Data Table( "semiconductor capability" )
dt = Open( "$SAMPLE_DATA/semiconductor capability.jmp" );
// For the example, Change column modeling type: wafer
Data Table( "semiconductor capability" ):wafer << Set Modeling Type( "Continuous" );

// Launch platform: Bootstrap Forest
bf = dt << Bootstrap Forest(
	Y( :wafer ),
	X(
		:NPN1, :PNP1, :PNP2, :NPN2, :PNP3, :IVP1, :PNP4, :NPN3, :IVP2, :NPN4, :SIT1, :INM1,
		:INM2, :VPM1, :VPM2, :VPM3, :PMS1, :SNM1, :SPM1, :NPN5, :EP2, :ZD6, :PBA, :PLG, :CAP,
		:PBA3, :PLG2, :PNP5, :NPN6, :PNP6, :PNP7, :NPN7, :PNP8, :IVP3, :IVP4, :IVP5, :IVP6,
		:PNP9, :NPN8, :NPN9, :IVP7, :NPN10, :N_1, :PBA1, :WPR1, :B10, :PLY10, :VBE210, :VTN210,
		:VTP210, :SIT2, :SIT3, :INV2, :INV3, :INV4, :INV5, :FST1, :FST2, :RES1, :RES2, :PNM1,
		:PPM1, :FNM1, :FPM1, :FST3, :FST4, :RES3, :RES4, :A1, :B1, :A2N, :A2P, :A2P1, :IVP8,
		:IVP9, :DE_H1, :NF_H1, :ESM1, :ESM2, :ESP1, :YFU1, :VPM4, :PBA2, :PBB1, :LYA1, :LYB1,
		:DEM1, :DEP1, :NFM1, :PLY1, :VDP1, :VDP2, :SNW1, :RSP2, :PLY2, :RSP1, :VDP3, :PBL1,
		:PLG1, :VDP4, :SPW1, :VIA1, :INM3, :VPM5, :VPM6, :INM4, :VPM7, :M1_M1, :M2_M2, :P1_P1,
		:E2A1, :E2B1, :NPN11, :IVP10, :PNP10, :INM5, :VPM8, :VPM9, :INM6, :VPM10, :N2A1, :N2B1,
		:NM_L1, :P2A1, :P2B1, :PM_L1, :P1, :M1
	),
	Method( "Bootstrap Forest" ),
	Portion Bootstrap( 1 ),
	Number Terms( 84 ),
	Number Trees( 100 ),
	Column Contributions( 1 ),
	Go
);

// Get Top 10 contibutors
orderedContributionList = Report( bf )["Column Contributions"][String Col Box( 1 )] << get;
// Reduce to 10
Remove From( orderedContributionList, 11, N Items( orderedContributionList ) - 10 );

// Create the 10 plots
For( i = 1, i <= 10, i++,
	Graph Builder(
		Size( 525, 454 ),
		Show Control Panel( 0 ),
		Variables( X( orderedContributionList[i] ), Y( :wafer ) ),
		Elements( Line Of Fit( X, Y, Legend( 8 ), R²( 1 ) ) )
	)
);
- Mark as New
- Bookmark
- Subscribe
- Mute
- Subscribe to RSS Feed
- Get Direct Link
- Report Inappropriate Content
Re: JSL help: Plot Bootstrap -feature imortance TOP 10 columns for graph builder
HI Txnelson-san,
Thanks for your kindly reply, very inspiring, for the bootstrap method I also have a question.
if I have 581 columns for my X factors, how about the parameters in JMP boostrap method you suggest to get the best accurarcy, any trick or experience you can share?
- For example "Number Terms( 200 ),Number Trees( 14 )", what's the best number for those parameters?
Validation( :Validation ),
Set Random Seed( 123 ),
Multithreading( 0 ),
Method( "Bootstrap Forest" ),
Column Contributions( 1 ),
ROC Curve( 1 ),
Lift Curve( 1 ),
Portion Bootstrap( 1 ),
Number Terms( 200 ),
Number Trees( 14 ),
Go
- Mark as New
- Bookmark
- Subscribe
- Mute
- Subscribe to RSS Feed
- Get Direct Link
- Report Inappropriate Content
Re: JSL help: Plot Bootstrap -feature imortance TOP 10 columns for graph builder
@txnelson Hi txnelson,
In python we can use gridsearch cv for the parameter optimization, but in JMP do you know how to do that and i also have another qustion above, but i forget to @you sorry, waiting for your reply, thanks in advance~
- Mark as New
- Bookmark
- Subscribe
- Mute
- Subscribe to RSS Feed
- Get Direct Link
- Report Inappropriate Content
Re: JSL help: Plot Bootstrap -feature imortance TOP 10 columns for graph builder
Take a look at the screening platforms.......in particular, Predictor Screening
- Mark as New
- Bookmark
- Subscribe
- Mute
- Subscribe to RSS Feed
- Get Direct Link
- Report Inappropriate Content
Re: JSL help: Plot Bootstrap -feature imortance TOP 10 columns for graph builder
@txnelson another question: sorry so many questions.
after I get the Top 10 from orederedContributionList[i], i want to plot scatter plot from another table dt30. and i use the for loop as below, seems the Graph builder for dt30 doesn't work and i didn't get any warning from log:
For( i = 1, i <= 10, i++,
dt30<<Graph Builder(
Size( 532, 10449 ),
Show Control Panel( 0 ),
Variables(
X( :Chamber ),
Y( X( orderedContributionList[i] ),
Page( :Step_ ),
Color( :Chamber )
),
Elements( Points( X, Y, Legend( 7 ) ) ),
),
Title ("Mean Value scatter plot")
)
);
- Mark as New
- Bookmark
- Subscribe
- Mute
- Subscribe to RSS Feed
- Get Direct Link
- Report Inappropriate Content
Re: JSL help: Plot Bootstrap -feature imortance TOP 10 columns for graph builder
I believe you have a syntax error
Y( X( orderedContributionList[i] ),should be
Y( orderedContributionList[i] ),- Mark as New
- Bookmark
- Subscribe
- Mute
- Subscribe to RSS Feed
- Get Direct Link
- Report Inappropriate Content
Re: JSL help: Plot Bootstrap -feature imortance TOP 10 columns for graph builder
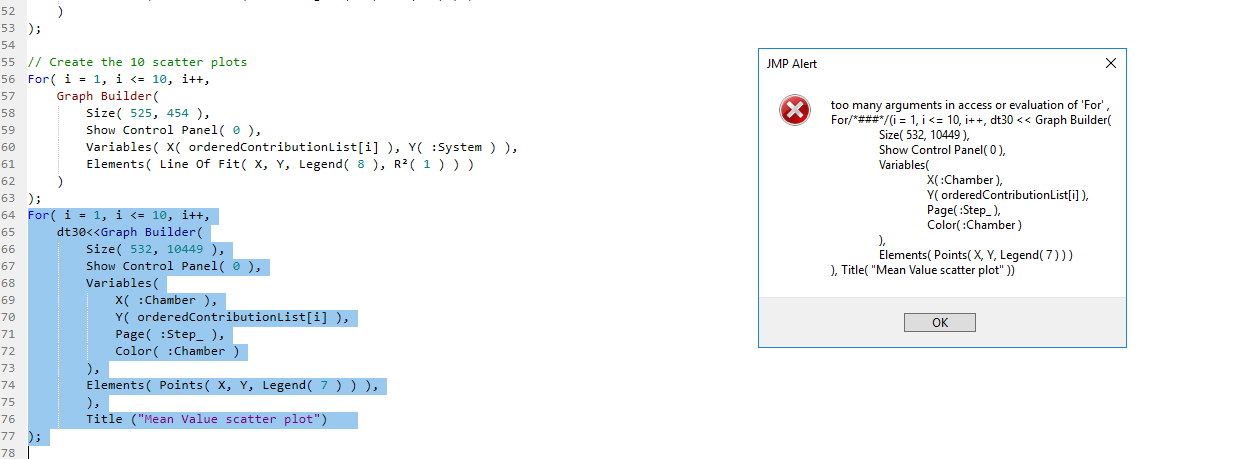
Thanks for your reply, but after I change that it warns me like too many parameter in for loop , as the picture below
The "graph builder" color is wrong as you can see it's bule but it should be brone, if it can be running without any warnings
- Mark as New
- Bookmark
- Subscribe
- Mute
- Subscribe to RSS Feed
- Get Direct Link
- Report Inappropriate Content
Re: JSL help: Plot Bootstrap -feature imortance TOP 10 columns for graph builder
When you had the "X (" in your code, you had matched parentheses. On it's removal, you needed to go back and arrange the parentheses to the functions you are using.
For( i = 1, i <= 10, i++,
	dt30 << Graph Builder(
		Size( 532, 10449 ),
		Show Control Panel( 0 ),
		Variables(
			X( :Chamber ),
			Y( orderedContributionList[i] ),
			Page( :Step_ ),
			Color( :Chamber )
		),
		Elements( Points( X, Y, Legend( 7 ) ) ),
		Title( "Mean Value scatter plot" )
	)
);Recommended Articles
- © 2026 JMP Statistical Discovery LLC. All Rights Reserved.
- Terms of Use
- Privacy Statement
- Contact Us