Turn on suggestions
Auto-suggest helps you quickly narrow down your search results by suggesting possible matches as you type.
- New to JMP? Join us Sept. 23-24 for the Early User Edition of Discovery Summit, tailor-made for new users. Register now for free!
- Your voice matters! Tell us how you prefer to receive JMP updates, so we can tailor our communication to your needs. Take short survey.
- See how to access JMP Marketplace - and - find, create & share add-ins to extend your JMP. Watch video.
Options
- Subscribe to RSS Feed
- Mark Topic as New
- Mark Topic as Read
- Float this Topic for Current User
- Bookmark
- Subscribe
- Mute
- Printer Friendly Page
Discussions
Solve problems, and share tips and tricks with other JMP users.- JMP User Community
- :
- Discussions
- :
- Re: JSL generate map graph

Level II
- Mark as New
- Bookmark
- Subscribe
- Mute
- Subscribe to RSS Feed
- Get Direct Link
- Report Inappropriate Content
JSL generate map graph
Created:
Mar 21, 2023 04:58 AM
| Last Modified: Jun 11, 2023 4:30 AM
(2447 views)
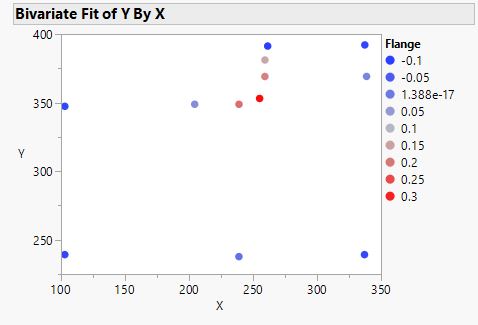
As the attachment, the JPG graph is manually generated, then save as JSL, when add for loop and use "char(columnname(i))" to place "Flange", it not display "Row Legend()".
manually generated:
Bivariate(
	Y(:Y),
	X(:X),
	SendToReport(
		Dispatch(
			{},
			"Bivar Plot",
			FrameBox,
			{Marker Size(5), Marker Drawing Mode("Normal"),
			Row Legend(
				Flange,
				Color(1),
				Color Theme("Blue to Gray to Red"),
				Marker(0),
				Marker Theme(""),
				Continuous Scale(1),
				Reverse Scale(0),
				Excluded Rows(0)
			)}
		)
	)
);- Tags:
- windows
1 ACCEPTED SOLUTION
Accepted Solutions

Super User
Solution
- Mark as New
- Bookmark
- Subscribe
- Mute
- Subscribe to RSS Feed
- Get Direct Link
- Report Inappropriate Content
Re: JSL generate map graph
If you change your JSL line in your attached JSL file from
Char( columnname(i)),to
Eval( columnname(i)),your script will work

Jim
1 REPLY 1
Super User
Solution
- Mark as New
- Bookmark
- Subscribe
- Mute
- Subscribe to RSS Feed
- Get Direct Link
- Report Inappropriate Content
Re: JSL generate map graph
If you change your JSL line in your attached JSL file from
Char( columnname(i)),to
Eval( columnname(i)),your script will work
Jim
Recommended Articles
- © 2026 JMP Statistical Discovery LLC. All Rights Reserved.
- Terms of Use
- Privacy Statement
- Contact Us