cancel
Showing results for 
Show  only  | Search instead for 
Did you mean: 
  • DownloadSemiconductor Toolkit: Tools to create wafer maps, add wafer geometry to graphics, explore die defects & compare wafers.
  • Discovery Summit 2026: Early User Edition - September 23-24.Register. It's free.
  • Use JMP Clinical with CDISC-compliant data. Review studies, ID safety and efficacy signals & communicate findings with interactive graphics. Register to see how. Aug. 27, 2 pm US ET.

Discussions

Solve problems, and share tips and tricks with other JMP users.
Choose Language Hide Translation Bar
olddabbler
Level I

JMP graph shown on computer is not the same as the JMP graph copied; phantom error bars appear

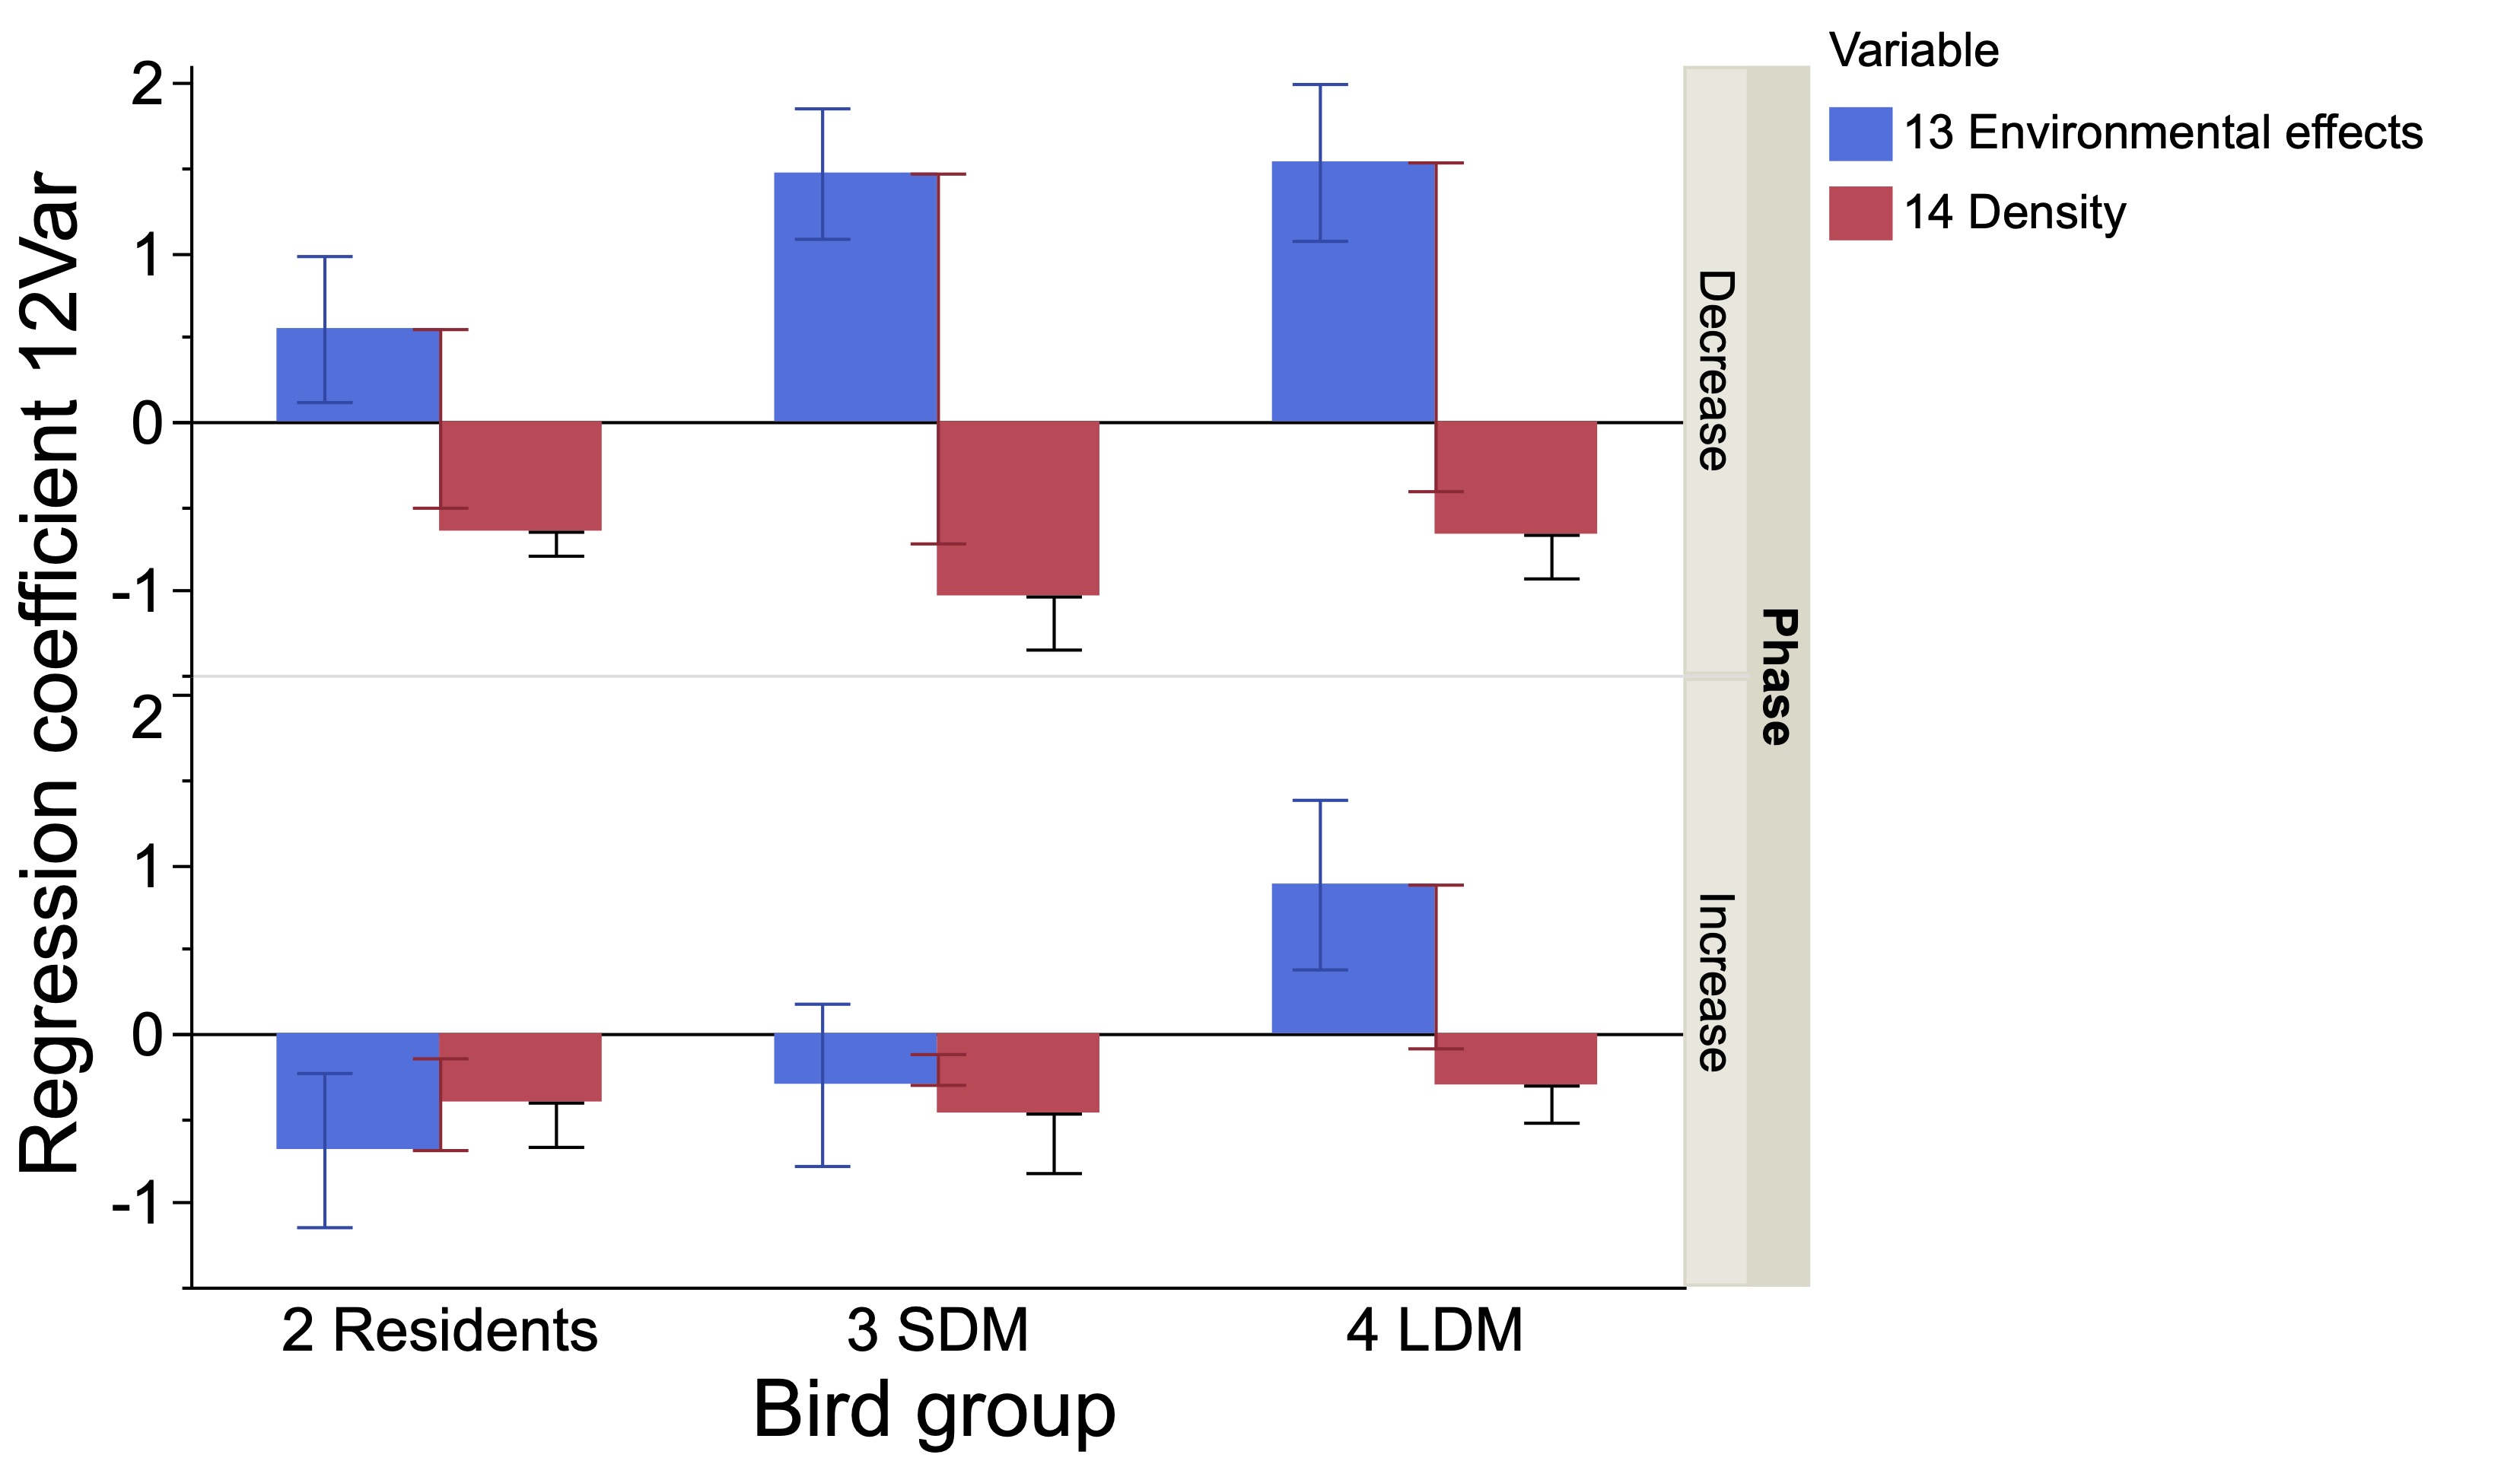
JMP graph builder adds a SE bar for data not included in the graph.  This error bar is not shown when the graph is displayed on my computer screen.  It appears only when the graph is copied to save as a jpeg or tiff file.   Compare the two figures attached.  I assume that this bar is associated with the "summary statistic" which automatically selects "mean".  The option for "None" as a summary statistic is not available when inserting error bars.  I prefer not to simply take a screen shot because the resolution of screenshots is low. I can find no options in JMP preferences that might address this issue.  Does anyone have an idea about how to get rid of this phantom error bar?

1 REPLY 1

Re: JMP graph shown on computer is not the same as the JMP graph copied; phantom error bars appear

I tried reproducing this behavior you describe and was not able to.  Could you please include a screenshot which includes the control panel options and the JSL script of the report.  Below is what I get when saving a similar visual from JMP.


mzwald_1-1741800345203.png


Recommended Articles