- Learn how to build custom Python data connectors and further customize JMP’s Data Connector Framework with the Python Data Connector Demo, available now in the JMP Marketplace!
- See how to move from signal modeling to system modeling at the first JMP Aerospace Analytics webinar. Register. June 18, 1 p.m. US Eastern Time.
- Subscribe to RSS Feed
- Mark Topic as New
- Mark Topic as Read
- Float this Topic for Current User
- Bookmark
- Subscribe
- Mute
- Printer Friendly Page
Discussions
Solve problems, and share tips and tricks with other JMP users.- JMP User Community
- :
- Discussions
- :
- Re: JMP graph into a powerpoint animation?

- Mark as New
- Bookmark
- Subscribe
- Mute
- Subscribe to RSS Feed
- Get Direct Link
- Report Inappropriate Content
JMP graph into a powerpoint animation?
Hello!
I'm wondering if it is possible to use a graph I built in JMP and make an animation of it in powerpoint? I'm thinking the answer is no but I thought I would ask...
Seems like Excel is possible but the only thing I can do with a JMP graph is copy the whole thing as a picture?
Thank you!
- Tags:
- windows

- Mark as New
- Bookmark
- Subscribe
- Mute
- Subscribe to RSS Feed
- Get Direct Link
- Report Inappropriate Content
Re: JMP graph into a powerpoint animation?
with "animation" you refer to an animated gif - or an interactive graph?
which part should be animated?
- Mark as New
- Bookmark
- Subscribe
- Mute
- Subscribe to RSS Feed
- Get Direct Link
- Report Inappropriate Content
Re: JMP graph into a powerpoint animation?
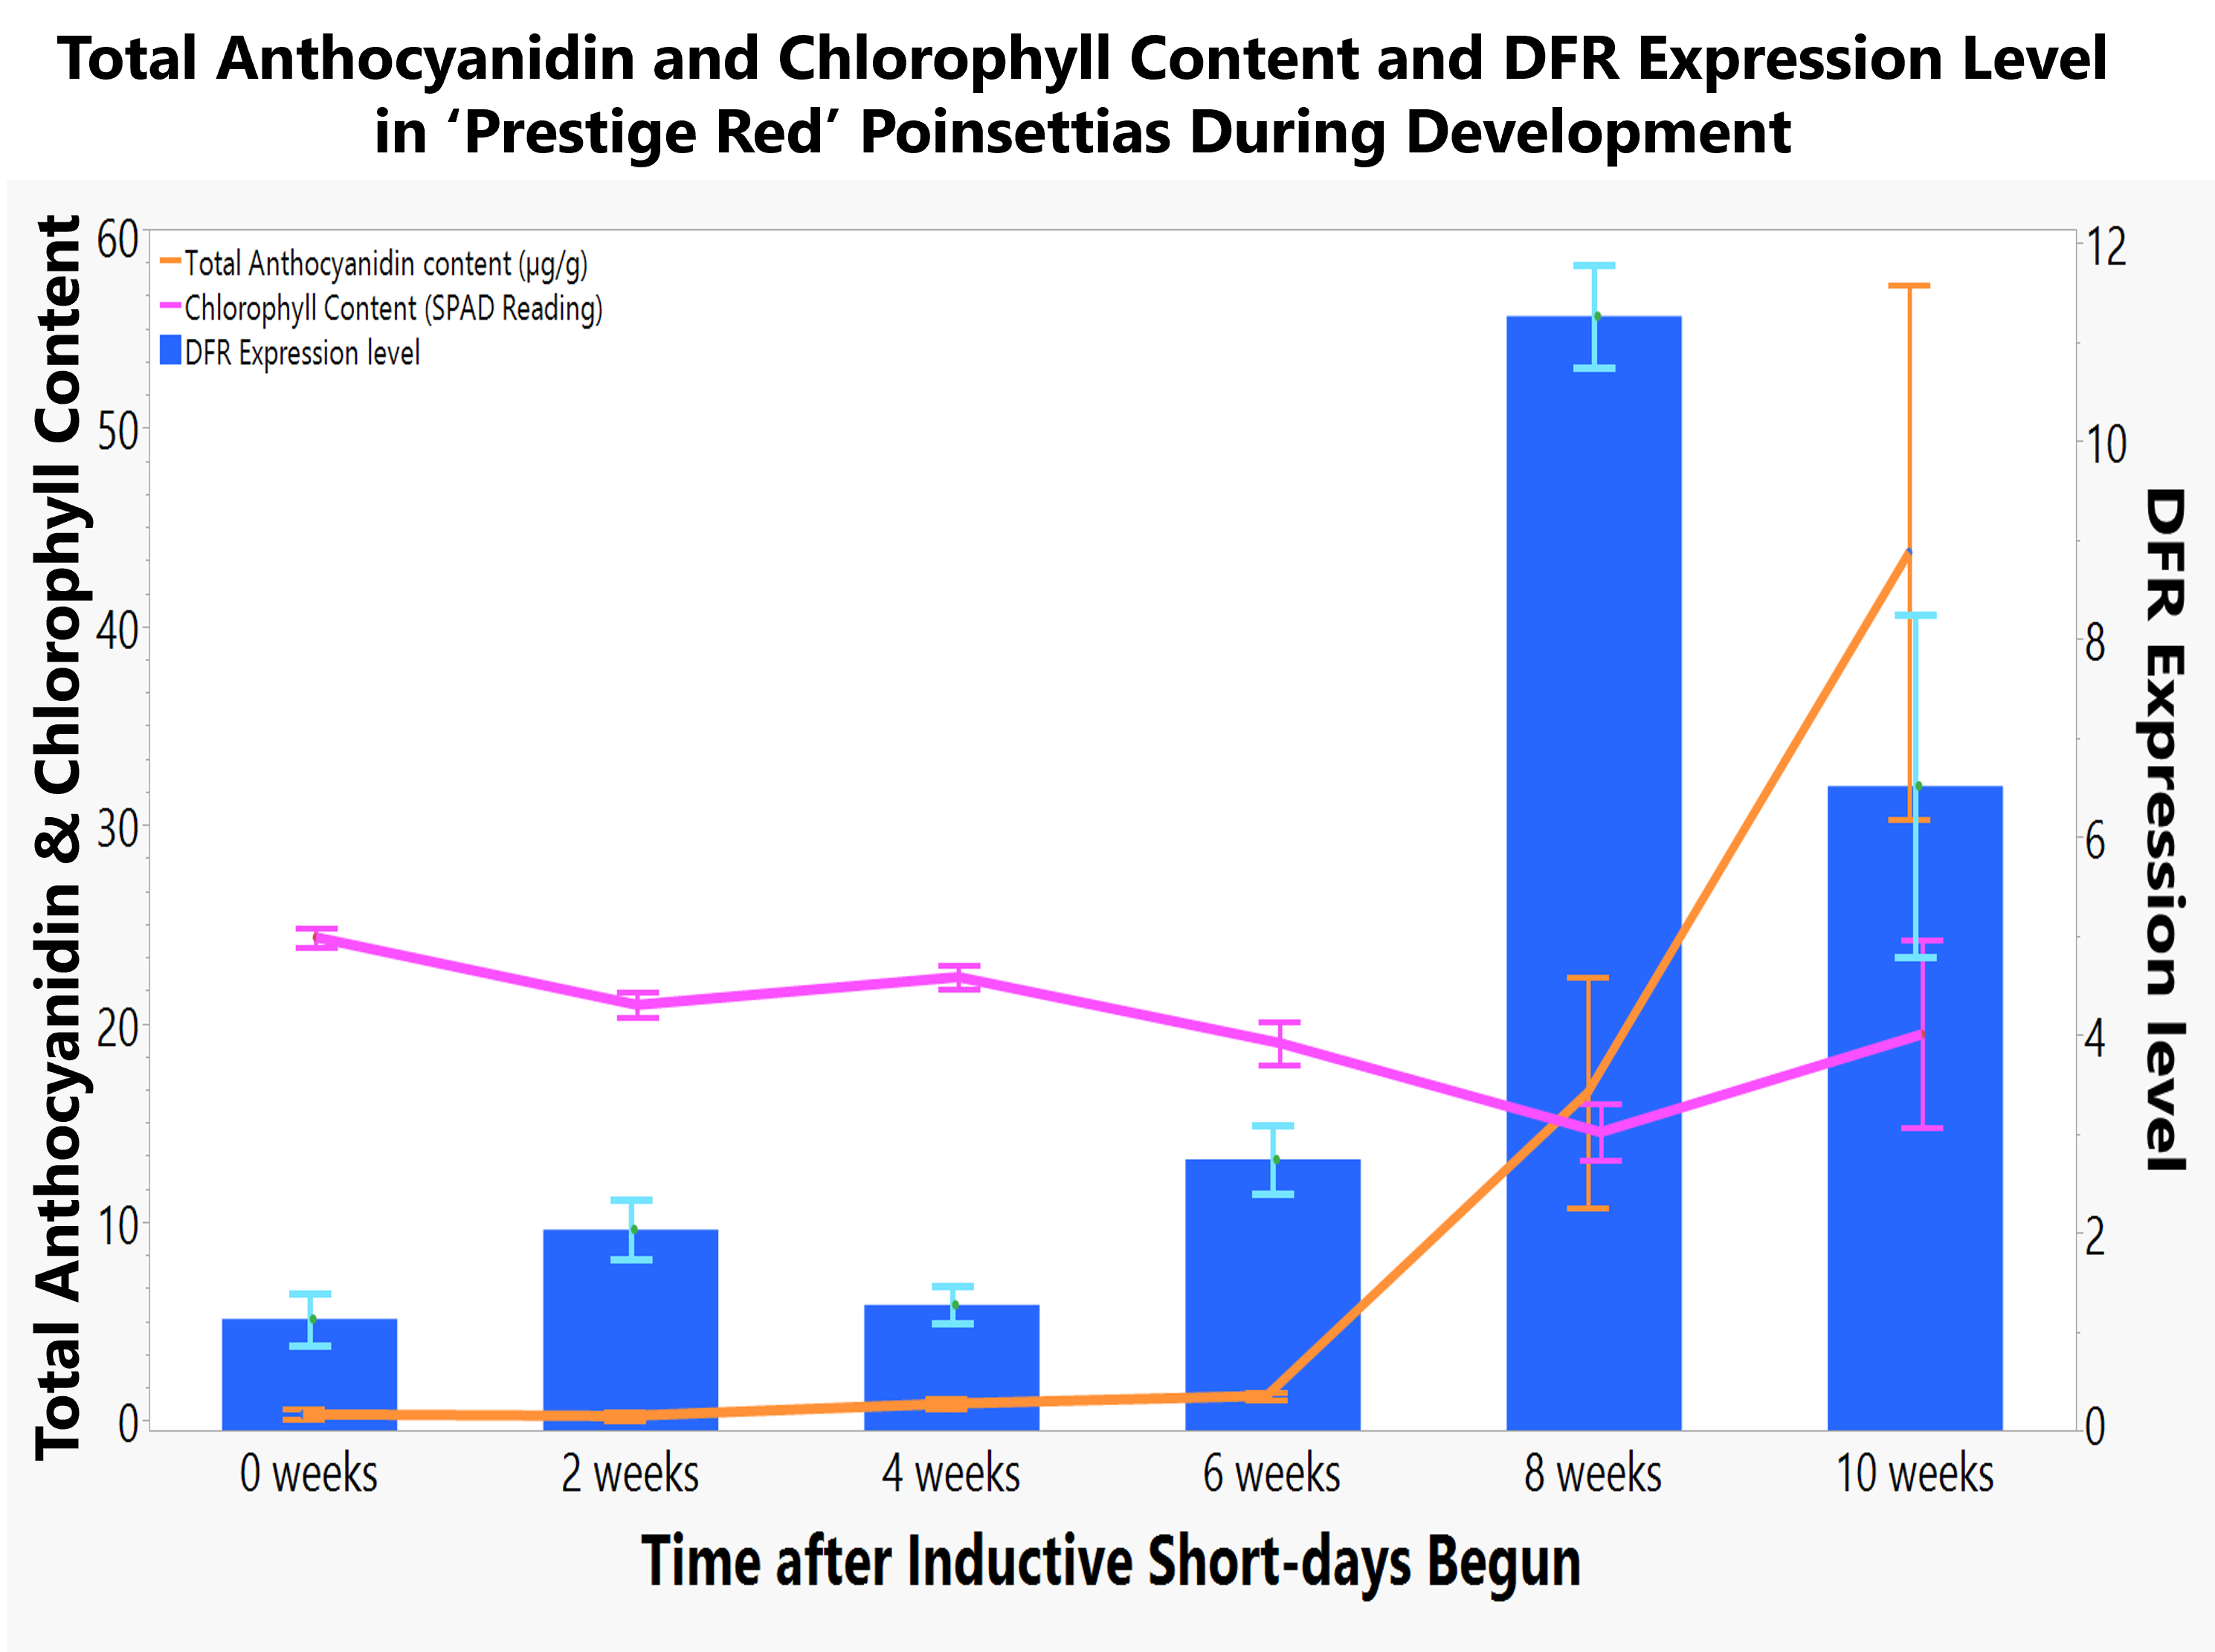
I have some combo line and bar graphs. Most have one element as bar and then two elements as lines. I wanted to bring in each line / bar separately as I talked about them. I believe that is animation? I haven't done this much....
- Mark as New
- Bookmark
- Subscribe
- Mute
- Subscribe to RSS Feed
- Get Direct Link
- Report Inappropriate Content
Re: JMP graph into a powerpoint animation?
Here is one example. Would like to bring in each line first and then the bar.
- Mark as New
- Bookmark
- Subscribe
- Mute
- Subscribe to RSS Feed
- Get Direct Link
- Report Inappropriate Content
Re: JMP graph into a powerpoint animation?
For the Data Filter, there exists an animate function:
unfortunately, the recorder doesn't seem to record the manual changes (save button is grey after the first part) - one has to use the buttons on top to cycle through the entries (save button is available at the end). Unfortunately, this is not the mode you are interested in :(
- Mark as New
- Bookmark
- Subscribe
- Mute
- Subscribe to RSS Feed
- Get Direct Link
- Report Inappropriate Content
Re: JMP graph into a powerpoint animation?
anyway, it will be hard to synchronize the automatically generated animation with your text ...
So, what you could do:
- install Graph Builder Toolbar
- use the local data filter to generate the individual steps
- for every step, click on the Powepoint logo in the Graphbuilder Toolbar *) and send the current plot as an image to Powerpoint
- go to Powerpoint, select all images and add animations

Recommended Articles
- © 2026 JMP Statistical Discovery LLC. All Rights Reserved.
- Terms of Use
- Privacy Statement
- Contact Us