- Don’t miss your chance to experience Discovery Summit Europe at our best available rate! Early bird registration through 31 Oct.
- Graph Builder Toolbar streamlines interactive graphing. Creates shortcuts on Report and GraphBuilder Helpers toolbars. Download and install the extension.
- JMP will suspend normal business operations for our Rest and Recharge Day on Friday, October 2, 2026.
Regular business hours will resume on Monday, October 5, 2026.
- Subscribe to RSS Feed
- Mark Topic as New
- Mark Topic as Read
- Float this Topic for Current User
- Bookmark
- Subscribe
- Mute
- Printer Friendly Page
Discussions
Solve problems, and share tips and tricks with other JMP users.- User Community
- :
- Discussions
- :
- Re: JMP 17 Fit Y by X Points NOT jittered

- Mark as New
- Bookmark
- Subscribe
- Mute
- Subscribe to RSS Feed
- Get Direct Link
- Report Inappropriate Content
JMP 17 Fit Y by X Points NOT jittered
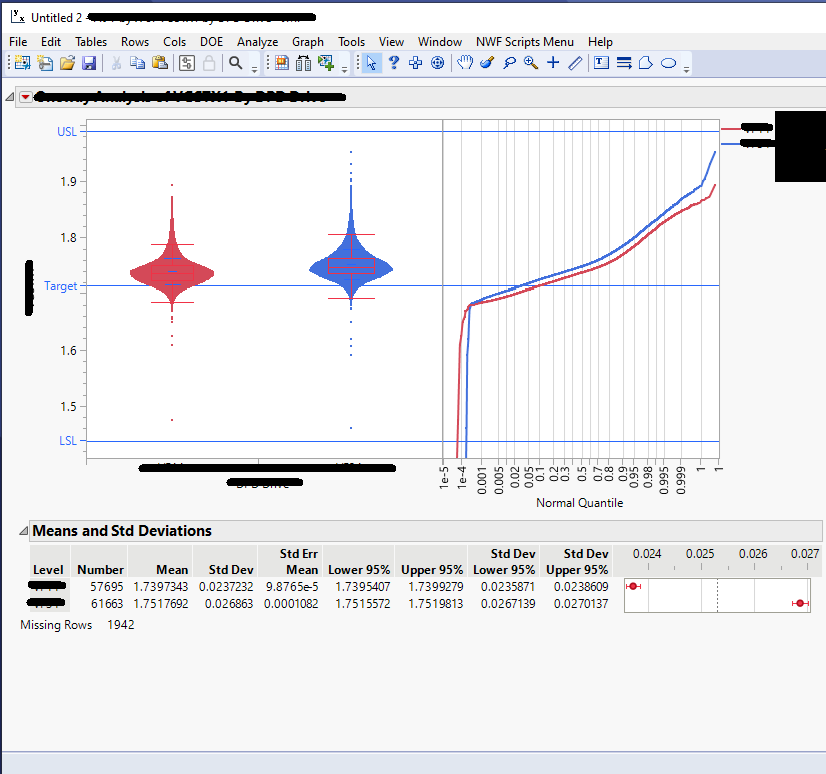
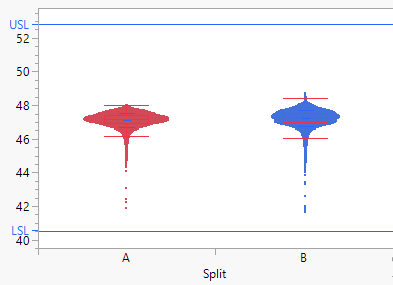
Since I have updated from JMP 16 to JMP 17 my variability charts have started behaving differently. Making the points jittered in JMP 17 look more like violin plots than jittered. This is frustrating since the new charts look ugly IMO.
Does anyone know if this was an intended change or this is some sort of bug?
Cheers.


- Mark as New
- Bookmark
- Subscribe
- Mute
- Subscribe to RSS Feed
- Get Direct Link
- Report Inappropriate Content
Re: JMP 17 Fit Y by X Points NOT jittered
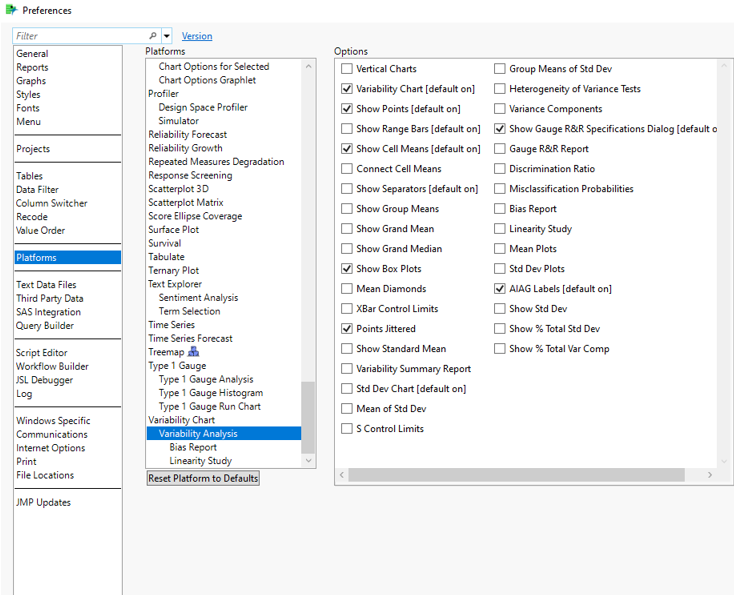
Are you talking about Variability chart of Fit Y by X? Title is about FitYbyX as is plot, text is for variability chart and so is preferences image?
Using JMP17.0.0, Fit Y by X
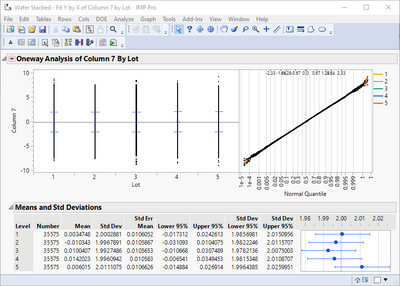
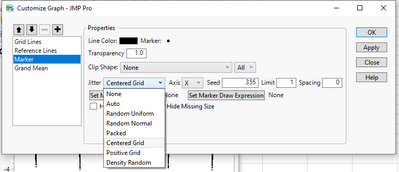
There are some settings in the right click customize menu which you could change
or preferences under Oneway
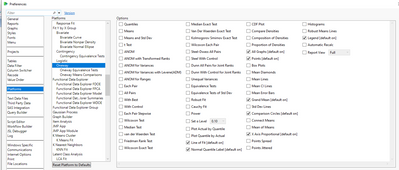
or change them from the platform (hold alt and left click on red triangle to open all options at the same time)
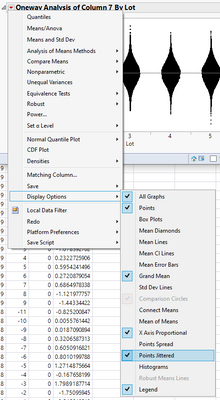
- Mark as New
- Bookmark
- Subscribe
- Mute
- Subscribe to RSS Feed
- Get Direct Link
- Report Inappropriate Content
Re: JMP 17 Fit Y by X Points NOT jittered
Hi Jthi,
Apologies, I meant the Fit Y by X graphs.
I have tried the settings you suggested and still nothing has changed.
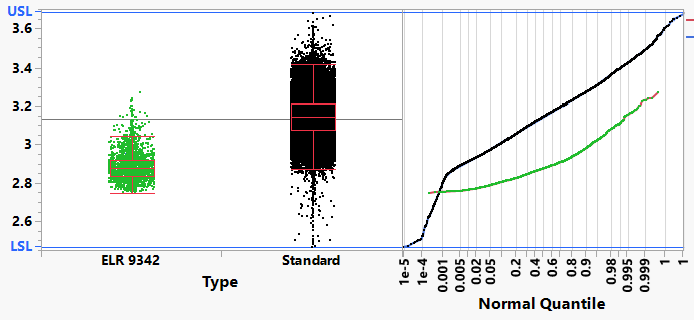
The Fit Y by X graphs used to look like this on JMP 16 when Jittered:
Now they look like this:


- Mark as New
- Bookmark
- Subscribe
- Mute
- Subscribe to RSS Feed
- Get Direct Link
- Report Inappropriate Content
Re: JMP 17 Fit Y by X Points NOT jittered
Right-click in the graph area of your Fit Y by X plot and choose Customize.
In the left-hand pane, choose Marker.
In the right-hand pane you will see options for the Jitter style.
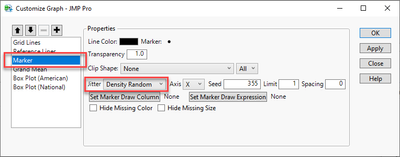
I think you will want either Packed or Density Random.

- Mark as New
- Bookmark
- Subscribe
- Mute
- Subscribe to RSS Feed
- Get Direct Link
- Report Inappropriate Content
Re: JMP 17 Fit Y by X Points NOT jittered
Hi Dan. I have to agree with Louie, in that the charts look awful when now defaulting to violin plots. I appreciate you've given the 'workaround', but I (and I'm sure Louie) would rather fix it permanently in Preferences. Do you know if this is possible?
Reverting back to Louie's question: ".... was this an intended change or this is some sort of bug?".
Thanks,
Kieran


- Mark as New
- Bookmark
- Subscribe
- Mute
- Subscribe to RSS Feed
- Get Direct Link
- Report Inappropriate Content
Re: JMP 17 Fit Y by X Points NOT jittered
Hi Dan. I have to agree with Kieran, who agrees with Louie!
I think the number of options have for jittering have just been extended, but not sure I would want this as a the default.
Recommended Articles
- © 2026 JMP Statistical Discovery LLC. All Rights Reserved.
- Terms of Use
- Privacy Statement
- Contact Us