Don’t miss your chance to experience Discovery Summit Europe at our best available rate! Early bird registration through 31 Oct.
Graph Builder Toolbar streamlines interactive graphing. Creates shortcuts on Report and GraphBuilder Helpers toolbars. Download and install the extension.
Created:
Jan 17, 2023 10:22 AM
| Last Modified: Jun 8, 2023 9:42 AM(1452 views)
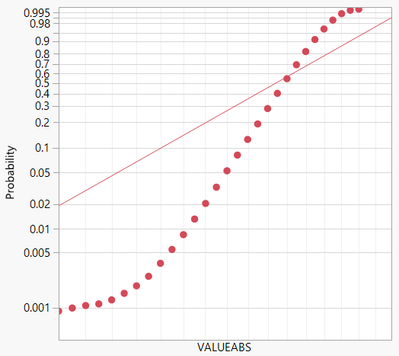
In the attached graph, Weibull Distribution, there are roughly 47K rows of data. The Fast Marker Threshold was set to 50K. I am looking for a way to show all data points on the graph. Any ideas?