cancel
Showing results for 
Show  only  | Search instead for 
Did you mean: 
  • DownloadSemiconductor Toolkit: Tools to create wafer maps, add wafer geometry to graphics, explore die defects & compare wafers.
  • Discovery Summit 2026: Early User Edition - September 23-24.Register. It's free.
  • Use JMP Clinical with CDISC-compliant data. Review studies, ID safety and efficacy signals & communicate findings with interactive graphics. Register to see how. Aug. 27, 2 pm US ET.

Discussions

Solve problems, and share tips and tricks with other JMP users.
Choose Language Hide Translation Bar
NaudV
Level I

Issues with "Label By Value" in Graph Builder

Hi,


I'm working with a logistic machine learning model and I would like to display the probability cutpoints on graph builder. However, I cannot display these values, even when selecting the "Label By Value" under Label. This is a picture of my output:
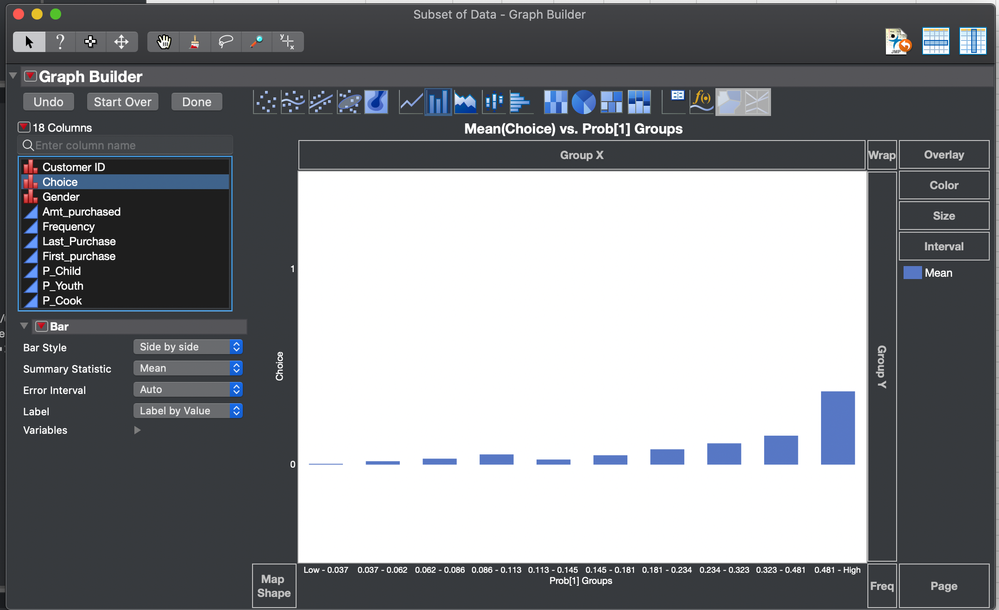
Screen Shot 2021-05-03 at 11.31.23 AM.png


Please let me know if you know how to fix this issue, thanks!

1 REPLY 1

Re: Issues with "Label By Value" in Graph Builder

Instead of doing a bar chart, change the graph type to a mosaic plot since you are plotting two categorical variables against each other. From here you can turn on labels and get the percentages for each group.

Recommended Articles