- New to JMP? Join us Sept. 23-24 for the Early User Edition of Discovery Summit, tailor-made for new users. Register now for free!
- Your voice matters! Tell us how you prefer to receive JMP updates, so we can tailor our communication to your needs. Take short survey.
- See how to access JMP Marketplace - and - find, create & share add-ins to extend your JMP. Watch video.
- Subscribe to RSS Feed
- Mark Topic as New
- Mark Topic as Read
- Float this Topic for Current User
- Bookmark
- Subscribe
- Mute
- Printer Friendly Page
Discussions
Solve problems, and share tips and tricks with other JMP users.- JMP User Community
- :
- Discussions
- :
- Issue adding control chart to dashboard

- Mark as New
- Bookmark
- Subscribe
- Mute
- Subscribe to RSS Feed
- Get Direct Link
- Report Inappropriate Content
Issue adding control chart to dashboard
Hi all,
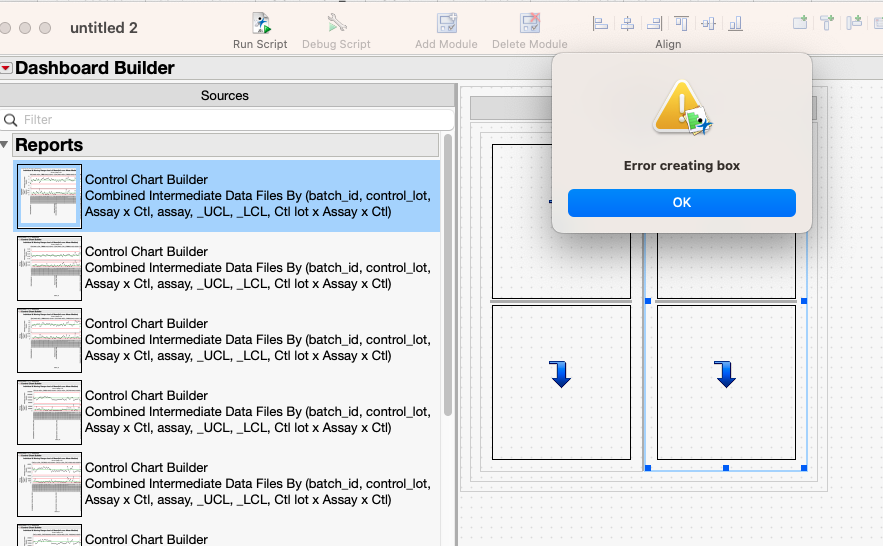
I'm trying to add several control charts to a dashboard and having issues. Specifically, seeing the attached error when trying to add the charts to a dashboard. I've tried this using Window < Combine Windows and also by creating a new Dashboard and using the Dashboard builder. Getting the same error for each. Control charts created using Control Chart Builder. Any thoughts?
-Matt
Accepted Solutions

- Mark as New
- Bookmark
- Subscribe
- Mute
- Subscribe to RSS Feed
- Get Direct Link
- Report Inappropriate Content
Re: Issue adding control chart to dashboard
Hi @barnabei - the issue here is the expression passed in the where() clause. JMP is retaining this expression as written, and when the script for the platform is saved and rerun, the variables no longer exist. This would also impact other actions that require the ability to rerun a platform from a script, such as publishing to JMP Live, or saving in a JMP Project. This example shows the same issue:
dt=Open("$SAMPLE_DATA/Big Class.jmp");
level=15;
biv = dt << Bivariate(X(:height),Y(:weight),Where(:age==level));
One way to fix it is to manipulate the expression to put in the actual level:
dt=Open("$SAMPLE_DATA/Big Class.jmp");
level=15;
Eval(EvalExpr(biv = dt << Bivariate(X(:height),Y(:weight),Where(:age==Expr(level)))));
Hope that helps!
- Mark as New
- Bookmark
- Subscribe
- Mute
- Subscribe to RSS Feed
- Get Direct Link
- Report Inappropriate Content
Re: Issue adding control chart to dashboard
Hi @barnabei - I'm unsure from the error whether it is the platform or perhaps the data table that is causing Dashboard Builder to fail to create the object. It might be helpful to know the JMP version, how the data table was created, and what the script for the Control Chart Builder looks like.
-Dan
- Mark as New
- Bookmark
- Subscribe
- Mute
- Subscribe to RSS Feed
- Get Direct Link
- Report Inappropriate Content
Re: Issue adding control chart to dashboard
Hi @danschikore , the JMP version is 17.0.0 (Mac).
See attached for the data table input (data deleted)
Script for creating control charts:
dtSum = Current Data Table();
Summarize( assaylist = by( :Assay x Ctl ) );
NAssays = Length( assaylist );
For( i = 1, i <= NAssays, i++,
	dtSum << Control Chart Builder(
		Variables(
			Subgroup( :batch_id ),
			Y( :"Mean(Inf conc Mean Median)"n ),
			Phase( :Ctl lot x Assay x Ctl )
		),
		Get Limits(
			"/Users/matt.barnabei/Desktop/QC Plotting Data/QC Limit Summary.jmp"
		),
		Show Control Panel( 0 ),
		Where( :Assay x Ctl == assaylist[i] ),
		SendToReport(
			Dispatch(
				{},
				"Control Chart Builder",
				FrameBox,
				{Frame Size( 0, 0 )}
			)
		)
	)
);- Mark as New
- Bookmark
- Subscribe
- Mute
- Subscribe to RSS Feed
- Get Direct Link
- Report Inappropriate Content
Re: Issue adding control chart to dashboard
Hi @barnabei - the issue here is the expression passed in the where() clause. JMP is retaining this expression as written, and when the script for the platform is saved and rerun, the variables no longer exist. This would also impact other actions that require the ability to rerun a platform from a script, such as publishing to JMP Live, or saving in a JMP Project. This example shows the same issue:
dt=Open("$SAMPLE_DATA/Big Class.jmp");
level=15;
biv = dt << Bivariate(X(:height),Y(:weight),Where(:age==level));
One way to fix it is to manipulate the expression to put in the actual level:
dt=Open("$SAMPLE_DATA/Big Class.jmp");
level=15;
Eval(EvalExpr(biv = dt << Bivariate(X(:height),Y(:weight),Where(:age==Expr(level)))));
Hope that helps!
Recommended Articles
- © 2026 JMP Statistical Discovery LLC. All Rights Reserved.
- Terms of Use
- Privacy Statement
- Contact Us