Turn on suggestions
Auto-suggest helps you quickly narrow down your search results by suggesting possible matches as you type.
- JMP Statement Regarding Critical PHP Remote Code Execution Vulnerabilities (CVE-2026-109618, CVE-2026-109619)
- Don’t miss your chance to experience Discovery Summit Europe at our best available rate! Early bird registration through 31 Oct.
- Graph Builder Toolbar streamlines interactive graphing. Creates shortcuts on Report and GraphBuilder Helpers toolbars. Download and install the extension.
Options
- Subscribe to RSS Feed
- Mark Topic as New
- Mark Topic as Read
- Float this Topic for Current User
- Bookmark
- Subscribe
- Mute
- Printer Friendly Page
Discussions
Solve problems, and share tips and tricks with other JMP users.- User Community
- :
- Discussions
- :
- Is it by design that header summary graphs aren't affected by column properties ...


Super User
- Mark as New
- Bookmark
- Subscribe
- Mute
- Subscribe to RSS Feed
- Get Direct Link
- Report Inappropriate Content
Is it by design that header summary graphs aren't affected by column properties such as Missing Value Codes and Value Labels?
Created:
Feb 14, 2023 05:43 AM
| Last Modified: Jun 8, 2023 9:36 AM
(3342 views)
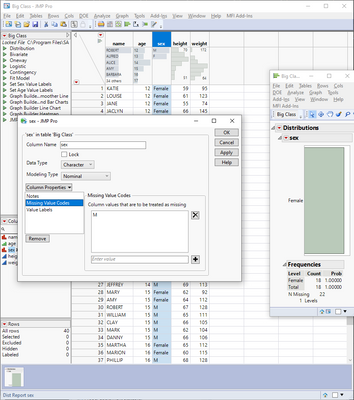
Is this by design that Column properties don't seem to affect header summary graphs?
Here I have set Missing Value Code to "M" and Value Label to F = "Female" and you can see difference between the header summary graphs and distribution plot:
-Jarmo
4 REPLIES 4

Level VII
- Mark as New
- Bookmark
- Subscribe
- Mute
- Subscribe to RSS Feed
- Get Direct Link
- Report Inappropriate Content
Re: Is it by design that header summary graphs aren't affected by column properties such as Missing Value Codes and Value Labels?
@jthi I don't think it is by design. Can you submit this to JMP Technical Support so that we can investigate this? Thanks.


Staff
- Mark as New
- Bookmark
- Subscribe
- Mute
- Subscribe to RSS Feed
- Get Direct Link
- Report Inappropriate Content
Re: Is it by design that header summary graphs aren't affected by column properties such as Missing Value Codes and Value Labels?
Sam is right. Notice that missing value codes are honored for the histograms for continuous columns.
Super User
- Mark as New
- Bookmark
- Subscribe
- Mute
- Subscribe to RSS Feed
- Get Direct Link
- Report Inappropriate Content
Re: Is it by design that header summary graphs aren't affected by column properties such as Missing Value Codes and Value Labels?
Message sent to support, TS-00034242.
-Jarmo

Level XIII
- Mark as New
- Bookmark
- Subscribe
- Mute
- Subscribe to RSS Feed
- Get Direct Link
- Report Inappropriate Content
Re: Is it by design that header summary graphs aren't affected by column properties such as Missing Value Codes and Value Labels?
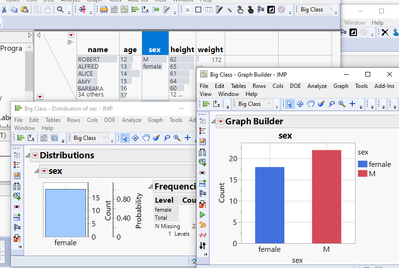
the issue with the value labels got fixed. (Jmp 17.2)
concerning Missing Value Code and non-continuous columns - hm,
Distribution seems to be the outlier. Will it be fixed to be consistent with the other plots?
Recommended Articles
- © 2026 JMP Statistical Discovery LLC. All Rights Reserved.
- Terms of Use
- Privacy Statement
- Contact Us