- Don’t miss your chance to experience Discovery Summit Europe at our best available rate! Early bird registration through 31 Oct.
- Graph Builder Toolbar streamlines interactive graphing. Creates shortcuts on Report and GraphBuilder Helpers toolbars. Download and install the extension.
- Subscribe to RSS Feed
- Mark Topic as New
- Mark Topic as Read
- Float this Topic for Current User
- Bookmark
- Subscribe
- Mute
- Printer Friendly Page
Discussions
Solve problems, and share tips and tricks with other JMP users.- User Community
- :
- Discussions
- :
- Re: Intro to Graph Builder Distribution

- Mark as New
- Bookmark
- Subscribe
- Mute
- Subscribe to RSS Feed
- Get Direct Link
- Report Inappropriate Content
Intro to Graph Builder Distribution
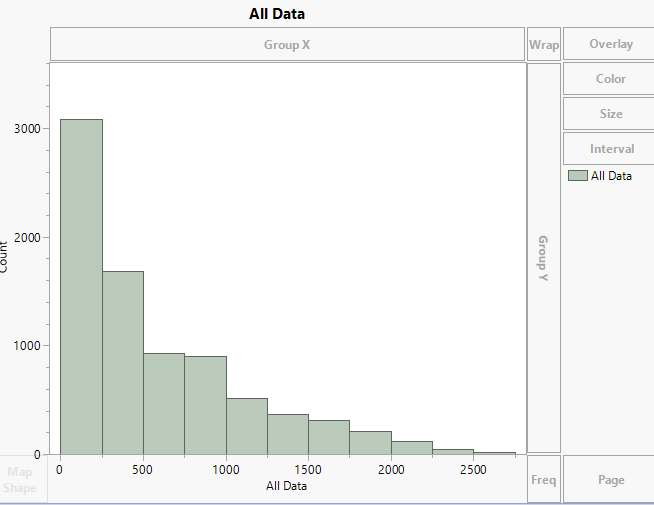
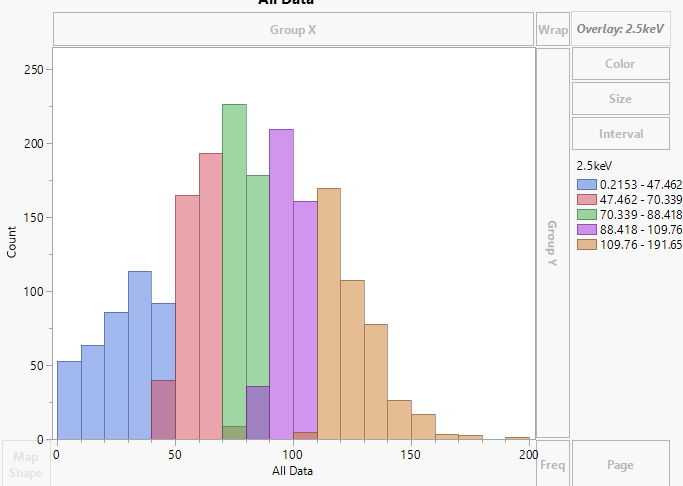
the second image shows what happens when I try to add the third data column. I'm not sure why it wont let me. It either replaces on of the existing data columns graphed or it switches to histogram mode. The goal is to overlay 2.5keV*6, 5keV*3,10keV*1.5, and 15keV. Thanks!
Accepted Solutions


- Mark as New
- Bookmark
- Subscribe
- Mute
- Subscribe to RSS Feed
- Get Direct Link
- Report Inappropriate Content
Re: Intro to Graph Builder Distribution
I replicated your findings. It does appear that using drag and drop of the X axis for 4 variables with a histogram display in Graph Builder, does change the graph from overlayed to side by side. However, if you stack the columns you want overlayed and then used the stacking group column as an overlay column, it will overlay more than 3 levels.


- Mark as New
- Bookmark
- Subscribe
- Mute
- Subscribe to RSS Feed
- Get Direct Link
- Report Inappropriate Content
Re: Intro to Graph Builder Distribution
Hi @hallef18 : The overlay column should be a Character variable with values 2.5keV*6, 5keV*3,10keV*1.5, and 15keV.
- Mark as New
- Bookmark
- Subscribe
- Mute
- Subscribe to RSS Feed
- Get Direct Link
- Report Inappropriate Content
Re: Intro to Graph Builder Distribution
I replicated your findings. It does appear that using drag and drop of the X axis for 4 variables with a histogram display in Graph Builder, does change the graph from overlayed to side by side. However, if you stack the columns you want overlayed and then used the stacking group column as an overlay column, it will overlay more than 3 levels.
- Mark as New
- Bookmark
- Subscribe
- Mute
- Subscribe to RSS Feed
- Get Direct Link
- Report Inappropriate Content
Re: Intro to Graph Builder Distribution
hmm, so you put all data into one column and graphed that? How did you get the different data to be sorted into the right colors for the label?
- Mark as New
- Bookmark
- Subscribe
- Mute
- Subscribe to RSS Feed
- Get Direct Link
- Report Inappropriate Content
Re: Intro to Graph Builder Distribution
Dropped the column that shows what the original column name was into the Overlay drop area
- Mark as New
- Bookmark
- Subscribe
- Mute
- Subscribe to RSS Feed
- Get Direct Link
- Report Inappropriate Content
Re: Intro to Graph Builder Distribution
I don't think I'm following. I put all the columns of data into one column and put that into "X" area on the lower axis. When I try to drop the original columns into overlay it only allows for 1 column overlay at a time. And it doesn't solidly color that one column of data out of "all data."
- Mark as New
- Bookmark
- Subscribe
- Mute
- Subscribe to RSS Feed
- Get Direct Link
- Report Inappropriate Content
Re: Intro to Graph Builder Distribution
Hi @hallef18 : The overlay column should be a Character variable with values 2.5keV*6, 5keV*3,10keV*1.5, and 15keV.
- Mark as New
- Bookmark
- Subscribe
- Mute
- Subscribe to RSS Feed
- Get Direct Link
- Report Inappropriate Content
Re: Intro to Graph Builder Distribution
I see thank you!
- Mark as New
- Bookmark
- Subscribe
- Mute
- Subscribe to RSS Feed
- Get Direct Link
- Report Inappropriate Content
Re: Intro to Graph Builder Distribution
As an example:
Open
Help=>Sample Data Folder=>Blood Presure.jmp

Stack the BP columns using
Tables=>Stack

Go to Graph Builder and Drag the Data column to the X Axis and the Label column to the Overlay drop area and then click on the Histogram icon


Recommended Articles
- © 2026 JMP Statistical Discovery LLC. All Rights Reserved.
- Terms of Use
- Privacy Statement
- Contact Us