- Instantly extract effect sizes, F-ratios, and FDR-adjusted p-values from your models with the Calculate Effects Sizes extension, available now in the JMP Marketplace!
- New to JMP? Join us Sept. 23-24 for the Early User Edition of Discovery Summit, tailor-made for new users. Register now for free!
- Your voice matters! Tell us how you prefer to receive JMP updates, so we can tailor our communication to your needs. Take short survey.
- Subscribe to RSS Feed
- Mark Topic as New
- Mark Topic as Read
- Float this Topic for Current User
- Bookmark
- Subscribe
- Mute
- Printer Friendly Page
Discussions
Solve problems, and share tips and tricks with other JMP users.- JMP User Community
- :
- Discussions
- :
- Re: IR Control charts limits

- Mark as New
- Bookmark
- Subscribe
- Mute
- Subscribe to RSS Feed
- Get Direct Link
- Report Inappropriate Content
IR Control charts limits
Hi,
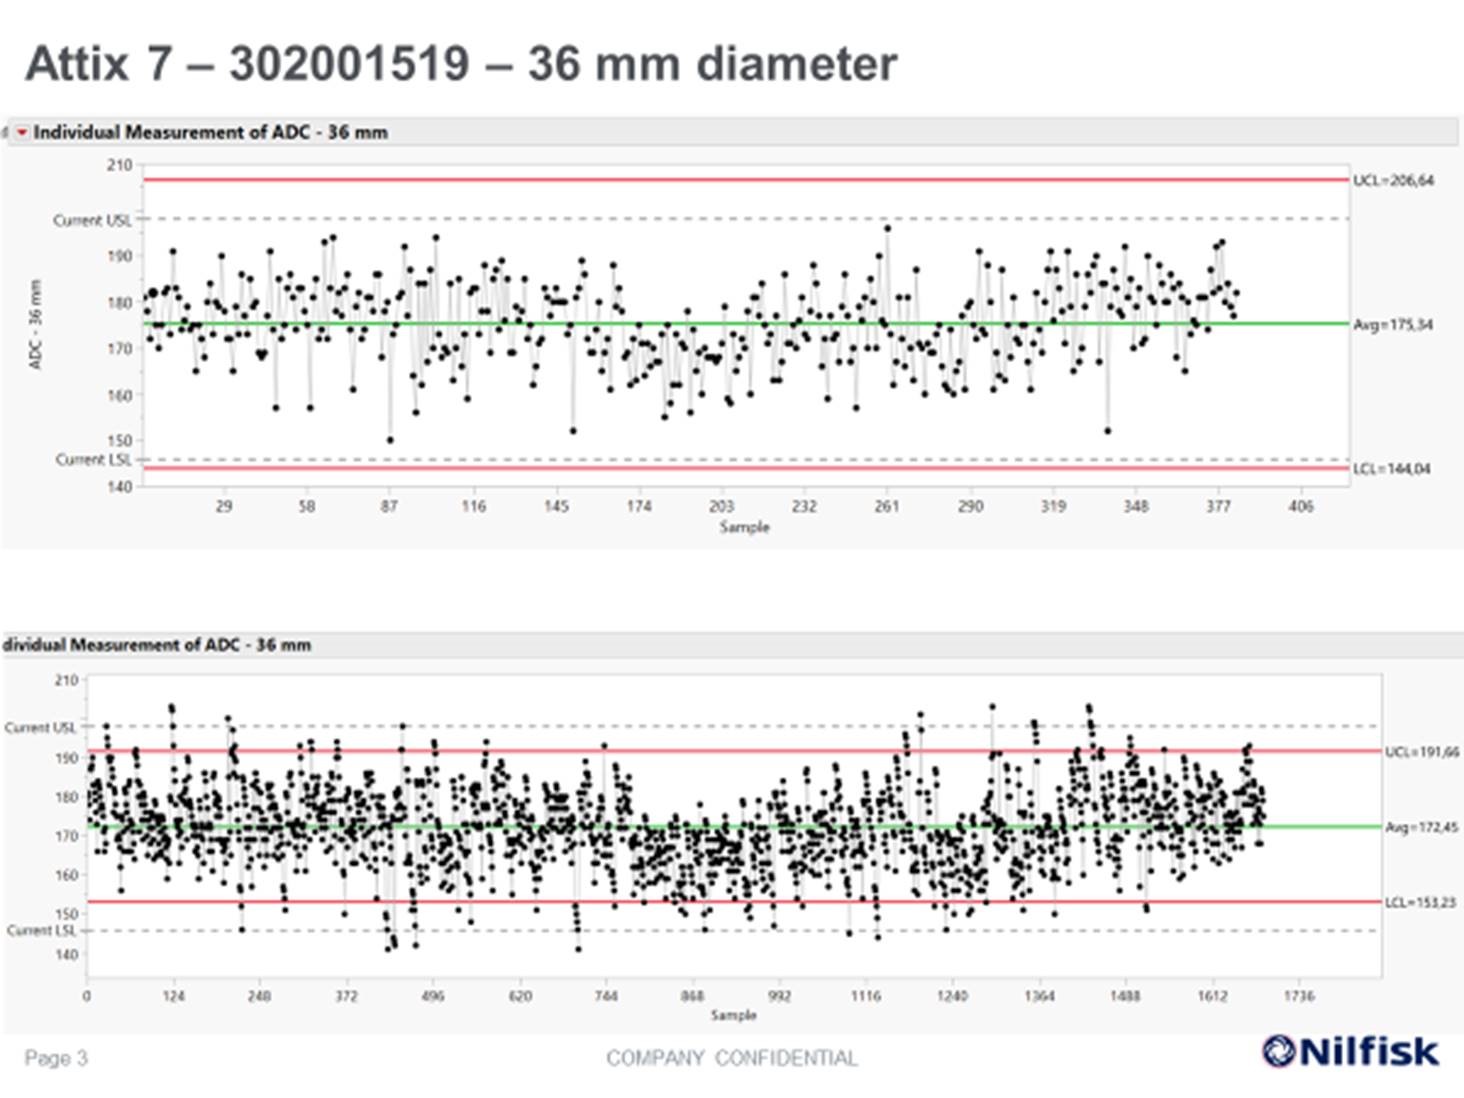
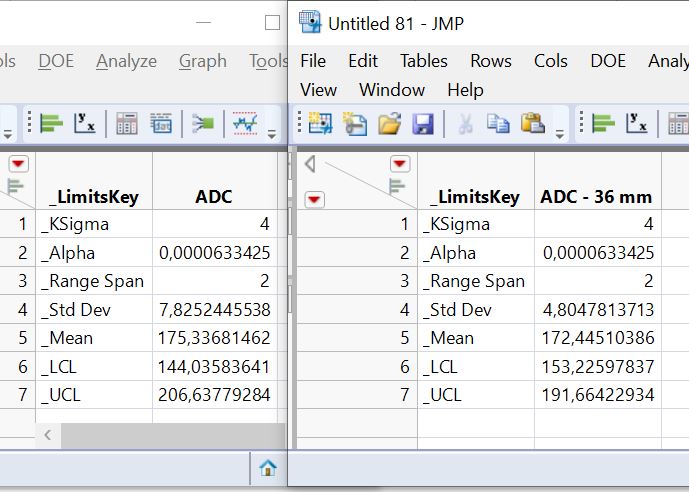
I have made two IR control charts with control limits set at 4-sigma (see attachment). The first chart has 383 rows and its std. deviation is 7.8. Whereas the second chart has1685 rows and its std. deviation is 4.8.
But when I visually compare the charts the second chart seems to have more variation but yet has a lower standard deviation and narrow limit than the first control chart. Does anyone any ideas what could be reason for this?
/Tahir
Accepted Solutions

- Mark as New
- Bookmark
- Subscribe
- Mute
- Subscribe to RSS Feed
- Get Direct Link
- Report Inappropriate Content
Re: IR Control charts limits
Your attached pictures only show the individuals charts. It is good practice to always look mat the MR chart before analyzing the Individuals charts. If there are unusual patterns or point outside the control limits indicating inconsistent, unstable (assignable cause) variation, then the estimates of MR are possibly incorrect. It is, of course, the estimate of the MR that is used to calculate the limits for the individuals charts. In an unstable, inconsistent situation ANY quantitative statistic is suspect.

- Mark as New
- Bookmark
- Subscribe
- Mute
- Subscribe to RSS Feed
- Get Direct Link
- Report Inappropriate Content
Re: IR Control charts limits
In a separate post you asked about the formulas for control limits. They can be easily found in the JMP documentation off of the help menu.

Notice that for an individuals chart, the moving range is used to estimate the standard deviation and create the control limits. Therefore, your example with the tighter control limits is likely caused by autocorrelation meaning that your data points are likely not all independent. Positive autocorrelation will lead to tighter control limits on an individuals control chart because the moving ranges do not adequately estimate the variability of the process.
- Mark as New
- Bookmark
- Subscribe
- Mute
- Subscribe to RSS Feed
- Get Direct Link
- Report Inappropriate Content
Re: IR Control charts limits
thanks for explaining the reason behind tight control limits for second control chart but it still seems odd that even though the overall variation is higher in the second chart but control limits are tighter.
I have seen the formula for the control chart but can you be so kind to send the formula for Standard deviation as well, is it same as 'sample standard deviation' used by excel or a different one?
- Mark as New
- Bookmark
- Subscribe
- Mute
- Subscribe to RSS Feed
- Get Direct Link
- Report Inappropriate Content
Re: IR Control charts limits
The standard deviation formula is not different for JMP. However, the standard deviation formula is not relevant for an individual moving range chart.
The standard deviation is a measure of variability that can be estimated in a number of ways. The formula that most people think of as the standard deviation is:

but this is only one way to estimate the variability. An individuals control chart, mostly for historical reasons, uses the moving range as noted in my previous post rather than the above formula. Another way to estimate the variability could be (for example) the range divided by 6.
I cannot make any recommendation on which type of chart you should use, but for comparison purposes you should make a Levey Jennings chart for each of your datasets. That type of chart does not use the moving range to estimate the variability. Instead, it uses the typical standard deviation formula. I think that chart might match your intuition on what you think the charts should look like.
- Mark as New
- Bookmark
- Subscribe
- Mute
- Subscribe to RSS Feed
- Get Direct Link
- Report Inappropriate Content
Re: IR Control charts limits
Your attached pictures only show the individuals charts. It is good practice to always look mat the MR chart before analyzing the Individuals charts. If there are unusual patterns or point outside the control limits indicating inconsistent, unstable (assignable cause) variation, then the estimates of MR are possibly incorrect. It is, of course, the estimate of the MR that is used to calculate the limits for the individuals charts. In an unstable, inconsistent situation ANY quantitative statistic is suspect.

- Mark as New
- Bookmark
- Subscribe
- Mute
- Subscribe to RSS Feed
- Get Direct Link
- Report Inappropriate Content
Re: IR Control charts limits
Hi, can I ask why you are using +/- 4 sigma? Is there not a high risk you miss signals?
Regards
Ian
Recommended Articles
- © 2026 JMP Statistical Discovery LLC. All Rights Reserved.
- Terms of Use
- Privacy Statement
- Contact Us