- Don’t miss your chance to experience Discovery Summit Europe at our best available rate! Early bird registration through 31 Oct.
- Image to Table JMP extension imports single or batch images as data tables. Useful to extract curves from pictures or convert image data to curve data to use in analyses like Functional Data Explorer. Download and install the extension.
- Subscribe to RSS Feed
- Mark Topic as New
- Mark Topic as Read
- Float this Topic for Current User
- Bookmark
- Subscribe
- Mute
- Printer Friendly Page
Discussions
Solve problems, and share tips and tricks with other JMP users.- User Community
- :
- Discussions
- :
- Re: How to write a script to use a specific row for plot bar chart?

- Mark as New
- Bookmark
- Subscribe
- Mute
- Subscribe to RSS Feed
- Get Direct Link
- Report Inappropriate Content
How to write a script to use a specific row for plot bar chart?
Hi all!
I want to plot a bar chart using a specific row in the data table. The format of the table is as following:

I am not sure what is the best way to do it.
My thought is to select the row, save it to a new data table, transpose the new table and then use the two columns in the new data table to plot the bar. The script for this method is a little bit long so I would like to know whether there is a more simple way for it.
Any help will be greatly appreciated!
Accepted Solutions


- Mark as New
- Bookmark
- Subscribe
- Mute
- Subscribe to RSS Feed
- Get Direct Link
- Report Inappropriate Content
Re: How to write a script to use a specific row for plot bar chart?
The "values( dt[0, 5] )" refers to the values to be placed into the data table. The "dt[0,5]" referred to the 5th row in the data table. It actually was an error in my code, it should have been, "values( dt[5, 0] )". The "0" refers to all columns in the data table. I have changed my code below to meet the new requirement.
Names Default To Here( 1 );
dt = Open( "$SAMPLE_DATA/blood pressure.jmp" );
dt << delete columns( 1, 2 );

rowNum = 5;

colNames = dt << get column names(string);


dt2 = New Table( "example",
	New Column( "Label", character, values( colNames ) ),
New Column( "Row " || char( rowNum ), values( dt[rowNum, 0 ] ) ) );- Mark as New
- Bookmark
- Subscribe
- Mute
- Subscribe to RSS Feed
- Get Direct Link
- Report Inappropriate Content
Re: How to write a script to use a specific row for plot bar chart?
Here is a simple example of one way to do what you want
Names Default To Here( 1 );
dt = Open( "$SAMPLE_DATA/blood pressure.jmp" );
dt << delete columns( 1, 2 );


dt2 = New Table( "example", New Column( "transpose", values( dt[0, 5] ) ) );- Mark as New
- Bookmark
- Subscribe
- Mute
- Subscribe to RSS Feed
- Get Direct Link
- Report Inappropriate Content
Re: How to write a script to use a specific row for plot bar chart?
Thank you for your reply, Jim!
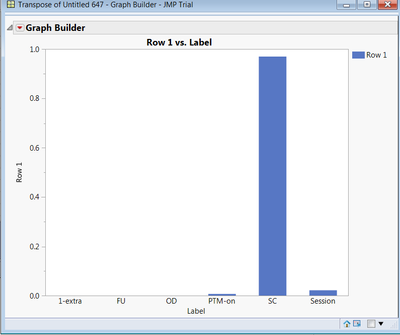
I don't get what "values( dt[0, 5] )" means here though. How can I just select the row that I want for the plot? For example, in my case, I only want to select row 132 as numeric values in y-axis for the plot and the names of the columns as the categorical names in the x-axis. Expected plot is as the following:
- Mark as New
- Bookmark
- Subscribe
- Mute
- Subscribe to RSS Feed
- Get Direct Link
- Report Inappropriate Content
Re: How to write a script to use a specific row for plot bar chart?
The "values( dt[0, 5] )" refers to the values to be placed into the data table. The "dt[0,5]" referred to the 5th row in the data table. It actually was an error in my code, it should have been, "values( dt[5, 0] )". The "0" refers to all columns in the data table. I have changed my code below to meet the new requirement.
Names Default To Here( 1 );
dt = Open( "$SAMPLE_DATA/blood pressure.jmp" );
dt << delete columns( 1, 2 );

rowNum = 5;

colNames = dt << get column names(string);


dt2 = New Table( "example",
	New Column( "Label", character, values( colNames ) ),
New Column( "Row " || char( rowNum ), values( dt[rowNum, 0 ] ) ) );Recommended Articles
- © 2026 JMP Statistical Discovery LLC. All Rights Reserved.
- Terms of Use
- Privacy Statement
- Contact Us