- JMP will suspend normal business operations for our Winter Holiday beginning on Wednesday, Dec. 24, 2025, at 5:00 p.m. ET (2:00 p.m. ET for JMP Accounts Receivable).
Regular business hours will resume at 9:00 a.m. EST on Friday, Jan. 2, 2026. - We’re retiring the File Exchange at the end of this year. The JMP Marketplace is now your destination for add-ins and extensions.
- Subscribe to RSS Feed
- Mark Topic as New
- Mark Topic as Read
- Float this Topic for Current User
- Bookmark
- Subscribe
- Mute
- Printer Friendly Page
Discussions
Solve problems, and share tips and tricks with other JMP users.- JMP User Community
- :
- Discussions
- :
- Re: How to use the tabulate function with raw data instead of summary statistics...
- Mark as New
- Bookmark
- Subscribe
- Mute
- Subscribe to RSS Feed
- Get Direct Link
- Report Inappropriate Content
How to use the tabulate function with raw data instead of summary statistics?
Dear community,
How can I use the tabulate function with the actual data of a continuous variable and not a summary statistic?
Or in other words: is there a way to create a table with a column and row headers in multiple levels but using the raw data?
Thanks,
T
- Tags:
- windows
- Mark as New
- Bookmark
- Subscribe
- Mute
- Subscribe to RSS Feed
- Get Direct Link
- Report Inappropriate Content
Re: How to use the tabulate function with raw data instead of summary statistics?
I'm unclear about what you want to do. But it sounds like the requirement that the tabulate row and column headings need to be nominal is what you want to avoid (if you put a continuous variable into either place, JMP will bin it to make it a nominal variable). If that is your problem, then I think you want to either stack or split columns to create a new data table rather than use the tabulate platform. It sounds like you want to keep all the raw data which means restructuring the data set without summarizing it. I don't think tabulate is the way to do that.
- Mark as New
- Bookmark
- Subscribe
- Mute
- Subscribe to RSS Feed
- Get Direct Link
- Report Inappropriate Content
Re: How to use the tabulate function with raw data instead of summary statistics?
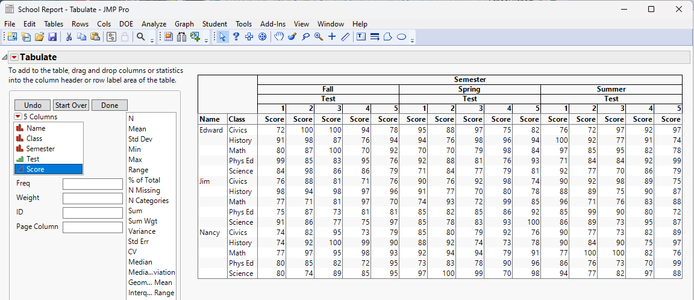
The data in each cell can be raw values, if it works out that only one row from the data table populates the cell. Here is an example:
Names Default To Here( 1 );

dt = New Table( "School Report",
	New Column( "Name", character ),
	New Column( "Class", character ),
	New Column( "Semester", character ),
	New Column( "Test", modeling type( ordinal ) ),
	New Column( "Score" )
);

nameList={"Jim","Nancy","Edward"};
classList={"Math","Science","Civics","History","Phys Ed"};
semesterList={"Fall","Spring","Summer"};
testList={1,2,3,4,5};

For Each( {Name}, nameList,
	For Each( {Class}, classList,
		For Each( {Semester}, semesterList,
			For Each( {Test}, testList,
				dt << add rows(1);
				dt:Name[nrows(dt)] = Name;
				dt:Class[nrows(dt)] = Class;
				dt:Semester[nrows(dt)] = Semester;
				dt:Test[nrows(dt)] = Test;
				dt:Score[nrows(dt)] = Random Integer( 70,100);
			)
		)
	)
);

dt << Tabulate(
	Change Item Label( Statistics( Sum, "Score" ) ),
	Remove Column Label( Analysis Columns( Score ) ),
	Add Table(
		Column Table(
			Grouping Columns( :Semester, :Test ),
			Analysis Columns( :Score )
		),
		Row Table( Grouping Columns( :Name, :Class ) )
	)
);
Recommended Articles
- © 2025 JMP Statistical Discovery LLC. All Rights Reserved.
- Terms of Use
- Privacy Statement
- Contact Us


