- JMP Statement Regarding Critical PHP Remote Code Execution Vulnerabilities (CVE-2026-109618, CVE-2026-109619)
- Don’t miss your chance to experience Discovery Summit Europe at our best available rate! Early bird registration through 31 Oct.
- Graph Builder Toolbar streamlines interactive graphing. Creates shortcuts on Report and GraphBuilder Helpers toolbars. Download and install the extension.
- Subscribe to RSS Feed
- Mark Topic as New
- Mark Topic as Read
- Float this Topic for Current User
- Bookmark
- Subscribe
- Mute
- Printer Friendly Page
Discussions
Solve problems, and share tips and tricks with other JMP users.- User Community
- :
- Discussions
- :
- How to run stats on C:N ratios

- Mark as New
- Bookmark
- Subscribe
- Mute
- Subscribe to RSS Feed
- Get Direct Link
- Report Inappropriate Content
How to run stats on C:N ratios
Hi everyone,
In my research I am examining Carbon:Nitrogen ratios. I have been unable to figure out how to run a statistical analysis on these ratios, and maybe it is not possible, I do not know. Attached is my data. Any guidance on this would be appreciated.
Thank you
Laura

- Mark as New
- Bookmark
- Subscribe
- Mute
- Subscribe to RSS Feed
- Get Direct Link
- Report Inappropriate Content
Re: How to run stats on C:N ratios
I change the ratio column to numeric values use the formula below, then you can run statistical analysis on this transformed column.
Num(Left(:Ratio, 2))on the numeric vales.

- Mark as New
- Bookmark
- Subscribe
- Mute
- Subscribe to RSS Feed
- Get Direct Link
- Report Inappropriate Content
Re: How to run stats on C:N ratios
Whatever analysis you have in mind, I would suggest starting with some 'simple' graphs (reading the appropriate documentation if you need to). As an example (not a recommendation):
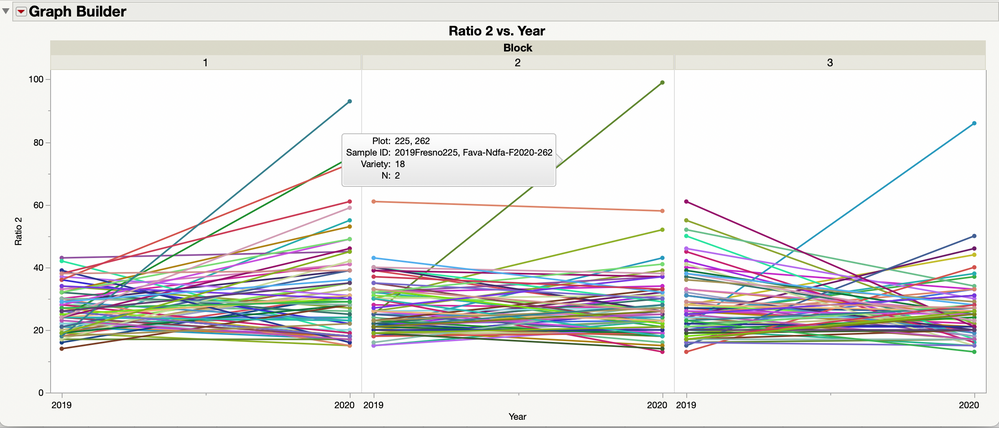
Since you know what the variables actually mean and what questions you want to address, you should soon be able to find a useful way to look at the data.
Recommended Articles
- © 2026 JMP Statistical Discovery LLC. All Rights Reserved.
- Terms of Use
- Privacy Statement
- Contact Us