- Instantly extract effect sizes, F-ratios, and FDR-adjusted p-values from your models with the Calculate Effects Sizes extension, available now in the JMP Marketplace!
- New to JMP? Join us Sept. 23-24 for the Early User Edition of Discovery Summit, tailor-made for new users. Register now for free!
- Your voice matters! Tell us how you prefer to receive JMP updates, so we can tailor our communication to your needs. Take short survey.
- Subscribe to RSS Feed
- Mark Topic as New
- Mark Topic as Read
- Float this Topic for Current User
- Bookmark
- Subscribe
- Mute
- Printer Friendly Page
Discussions
Solve problems, and share tips and tricks with other JMP users.- JMP User Community
- :
- Discussions
- :
- Re: How to refresh data in a new table within JSL script

- Mark as New
- Bookmark
- Subscribe
- Mute
- Subscribe to RSS Feed
- Get Direct Link
- Report Inappropriate Content
How to refresh data in a new table within JSL script
Hello -
I am currently writing a script that will ultimately display a report for me. I can get all preceding tables/graphs to refresh accordingly when the data source's data is updated, but I'm not sure why the final table in the script doesn't update (labeled /* FINAL REPORT */). Am I missing a line so I can pull in data from the data source? Thank you in advance!
Names Default To Here( 1 );

CumulativeData = Open(
	"/Users/NAME/Desktop/JMP/Customer1_Data_05232018.xlsx",
	Worksheets( "Cumulative_Data_Customer1" ),
	Use for all sheets( 1 ),
	Concatenate Worksheets( 0 ),
	Create Concatenation Column( 0 ),
	Worksheet Settings(
		1,
		Has Column Headers( 1 ),
		Number of Rows in Headers( 1 ),
		Headers Start on Row( 1 ),
		Data Starts on Row( 2 ),
		Data Starts on Column( 1 ),ho
		Data Ends on Row( 0 ),
		Data Ends on Column( 0 ),
		Replicated Spanned Rows( 1 ),
		Replicated Spanned Headers( 0 ),
		Suppress Hidden Rows( 1 ),
		Suppress Hidden Columns( 1 ),
		Suppress Empty Columns( 1 ),
		Treat as Hierarchy( 0 ),
		Multiple Series Stack( 0 ),
		Import Cell Colors( 0 ),
		Limit Column Detect( 0 ),
		Column Separator String( "-" )
	)
);

FitLineGraph = CumulativeData << Bivariate(
	Y( :Cumulative ),
	X( :Day of year ),
	Fit Where(
		:Customer == "Customer1",
		Fit Line( {Line Color( {212, 73, 88} )} )
	)
);


CombinedTable = platform = Data Table( "Cumulative_Data_Customer1" ) <<
Bivariate(
	Y( :Cumulative ),
	X( :Day of year ),
	Fit Where(
		:Customer == "Customer1",
		Fit Line( {Line Color( {212, 73, 88} )} )
	)
);
Wait( 0 );
Report( platform )[Outline Box( "Bivariate Fit of Cumulative By Day of year" )][
Outline Box( "Linear Fit Customer==\!"Customer1\!"" )][
Outline Box( "Parameter Estimates" )][Table Box( 1 )] << Make Combined Data Table;
Report( platform ) << Close Window;


/* FINAL REPORT */
CampaignFulfillment = New Table( "Campaign Fulfillment",
	Add Rows( 1 ),
	New Script(
		"Source",
		Data Table( CombinedTable ) << Split(
			Split By( :Term ),
			Split( :Estimate ),
			Sort by Column Property
		)
	),
	New Script(
		"Make Combined Data Table",
		Names Default To Here( 1 );
		platform = Data Table( "Cumulative_Data_Customer1" ) <<
		Bivariate(
			Y( :Cumulative ),
			X( :Data per day ),
			Fit Where(
				:Customer == "Customer1",
				Fit Line( {Line Color( {212, 73, 88} )} )
			)
		);
		Wait( 0 );
		Report( platform )[Outline Box( "Bivariate Fit of Cumulative By Day of year"
		)][Outline Box( "Linear Fit Customer==\!"Customer1\!"" )][
		Outline Box( "Parameter Estimates" )][Table Box( 1 )] <<
		Make Combined Data Table;
		Report( platform ) << Close Window;
	),
	New Column( "Customer", Character, "Nominal", Set Values( {"Customer1"} ) ),
	New Column( "Data Guarantee",
		Numeric,
		"Continuous",
		Format( "Fixed Dec", 12, 0 ),
		Set Values( [3600] )
	),
	New Column( "Program Length Target",
		Numeric,
		"Continuous",
		Format( "Fixed Dec", 12, 0 ),
		Set Values( [365] )
	),
	New Column( "Data per day",
		Numeric,
		"Continuous",
		Format( "Best", 12 ),
		Set Values( [9.90692146417355] )
	),
	New Column( "X",
		Character,
		"Nominal",
		Hide,
		Exclude,
		Set Values( {"Day of year"} )
	),
	New Column( "Y",
		Character,
		"Nominal",
		Hide,
		Exclude,
		Set Values( {"Cumulative"} )
	),
	New Column( "~Bias", Character, "Nominal", Hide, Exclude, Set Values( {""} ) ),
	New Column( "Std Error",
		Numeric,
		"Continuous",
		Format( "Best", 12 ),
		Hide,
		Exclude,
		Set Values( [0.0596952471880355] )
	),
	New Column( "t Ratio",
		Numeric,
		"Continuous",
		Format( "Fixed Dec", 12, 2 ),
		Hide,
		Exclude,
		Set Values( [165.958295355868] )
	),
	New Column( "Prob>|t|",
		Numeric,
		"Continuous",
		Format( "PValue", 12 ),
		Hide,
		Exclude,
		Set Values( [4.75743232959739e-156] )
	),
	New Column( "Intercept",
		Numeric,
		"Continuous",
		Format( "Best", 12 ),
		Hide,
		Exclude,
		Set Values( [-96.5323780670815] )
	),
	New Column( "Estimated # at Target Date",
		Numeric,
		"Continuous",
		Format( "Fixed Dec", 12, 0 ),
		Formula( :Data per day * :Program Length Target )
	),
	New Column( "Delta to Target",
		Numeric,
		"Continuous",
		Format( "Fixed Dec", 12, 0 ),
		Formula( :Estimated # at Target Date - :Data Guarantee )
	),
	New Column( "Percent Deviation",
		Numeric,
		"Continuous",
		Format( "Fixed Dec", 12, 0 ),
		Formula( (:Delta to Target / :Data Guarantee) * 100 ),
		Set Property(
			"Color Gradient",
			{{"Variance Evaluation", 16387, {{252, 0, 7}, {235, 255, 10}, {33, 224,
			9}, {255, 248, 16}, {12, 108, 255}}, {0.00797872340425532,
			0.247340425531915, 0.502659574468085, 0.726063829787234, 1}},
			Range( {-10, 10, 0} )}
		),
		Color Cell by Value,
		Set Selected
	)
)
- Mark as New
- Bookmark
- Subscribe
- Mute
- Subscribe to RSS Feed
- Get Direct Link
- Report Inappropriate Content
Re: How to refresh data in a new table within JSL script
You have an error in your script. I believe you want this definition of CombinedTable.
CombinedTable=Report(platform).... <<Make Combined Data Table;
Since the data table you are creating has this portion of JSL as a table script, it will need to be fixed as well.
Also, you have defined only one row in data table CampaignFulfilment, with fixed values. I see no JSL code to add data or make that table dynamic.
Please describe what you expect the script to do.
platform = Data Table( "Cumulative_Data_Customer1" ) <<
Bivariate(
	Y( :Cumulative ),
	X( :Day of year ),
	Fit Where(
		:Customer == "Customer1",
		Fit Line( {Line Color( {212, 73, 88} )} )
	)
);
Wait( 0 );
CombinedTable =Report( platform )[Outline Box( "Bivariate Fit of Cumulative By Day of year" )][
Outline Box( "Linear Fit Customer==\!"Customer1\!"" )][
Outline Box( "Parameter Estimates" )][Table Box( 1 )] << Make Combined Data Table;
Report( platform ) << Close Window;
- Mark as New
- Bookmark
- Subscribe
- Mute
- Subscribe to RSS Feed
- Get Direct Link
- Report Inappropriate Content
Re: How to refresh data in a new table within JSL script
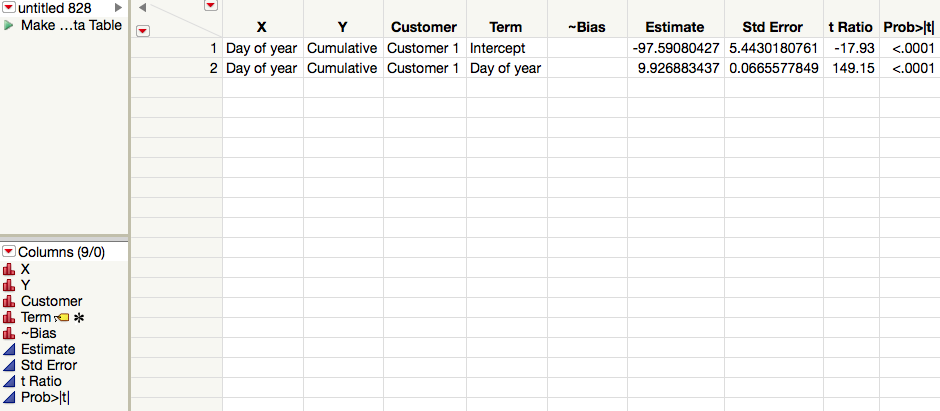
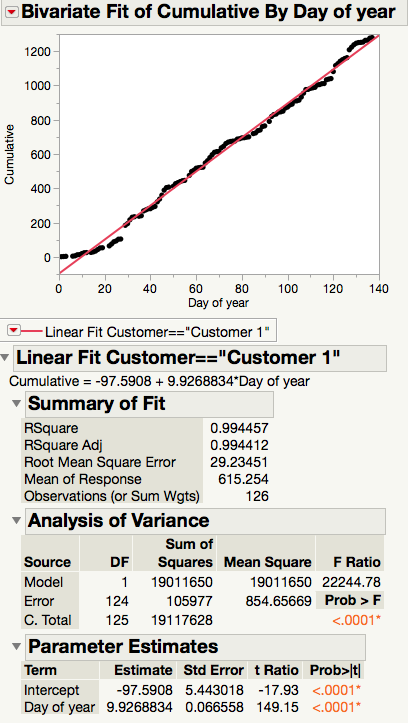
I'm not sure how to make my table dynamic and would like to make that happen. My goal is to have the CampaignFulfillment table, the split table, to auto refresh when the data source updates. The "Data by day" number in CampaginFulfillment is pulled from CombinedTable and that number is created when a fit line is added to the graph I created.
I have attached images of what everything looks like.
Thanks!
Recommended Articles
- © 2026 JMP Statistical Discovery LLC. All Rights Reserved.
- Terms of Use
- Privacy Statement
- Contact Us