- New to JMP? Join us Sept. 23-24 for the Early User Edition of Discovery Summit, tailor-made for new users. Register now for free!
- Subscribe to RSS Feed
- Mark Topic as New
- Mark Topic as Read
- Float this Topic for Current User
- Bookmark
- Subscribe
- Mute
- Printer Friendly Page
Discussions
Solve problems, and share tips and tricks with other JMP users.- JMP User Community
- :
- Discussions
- :
- How to quantitatively compare particle distributions??

- Mark as New
- Bookmark
- Subscribe
- Mute
- Subscribe to RSS Feed
- Get Direct Link
- Report Inappropriate Content
How to quantitatively compare particle distributions??
Ok, so I have a large data set that has particle size distributions (surface area for each particle in the sample) for over 100 samples and I need a way to quantitatively (or semi-quantitatively) compare them to the whole data set or sort into groups with similar distribution characteristics. The vast majority of the points are in the very small size fraction but due to the very small size do not contribute proportionally all that much to the total area.
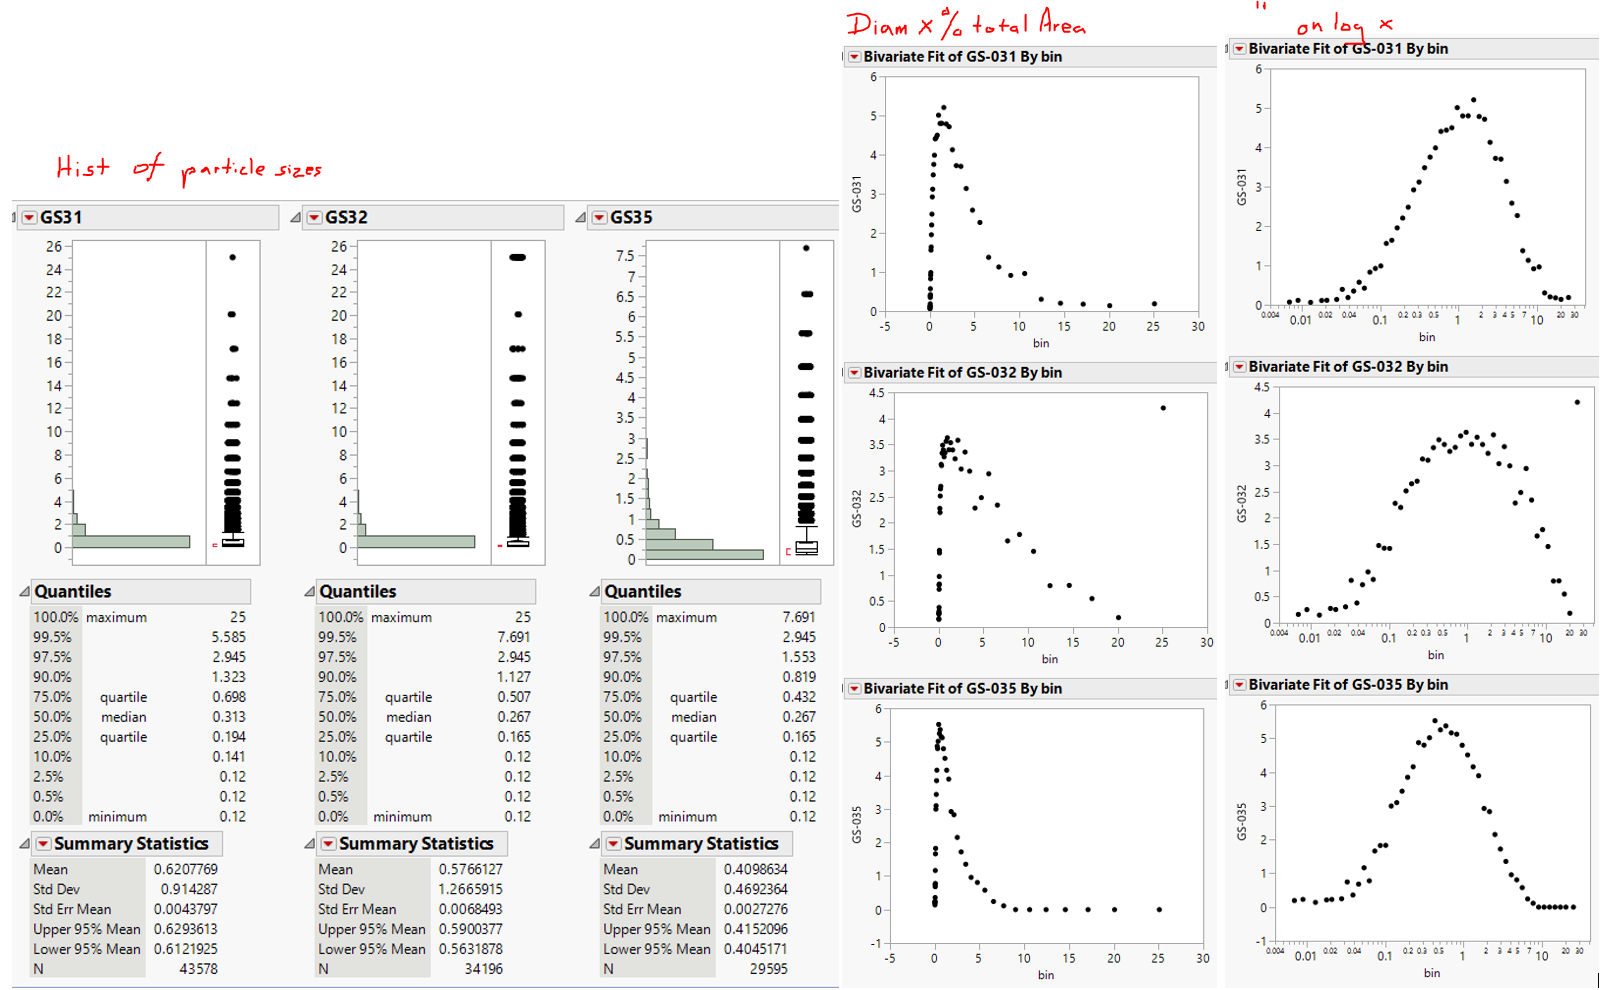
I have attached sample plots of three representative samples with visually different distributions.
-Histograms of the raw data where the y axis is the particle size
-xy plots of the particle size (bin=x axis) vs the percentage that size bin contributes to the total area (y axis). Two versions are shown, linear and log x axes (obviously log normal distributions here).
Eventually, these need to be visually comparable to one another (classes?) when the samples are plotted in real space relative to their collection point to delineate spatial patterns (purely visual). I have been banging my head on this matter for weeks. If anyone could help me I would be greatly obliged!
Thank you!

- Mark as New
- Bookmark
- Subscribe
- Mute
- Subscribe to RSS Feed
- Get Direct Link
- Report Inappropriate Content
Re: How to quantitatively compare particle distributions??
How about comparing non-parametric distribution estimates of individual samples? Here is an example using the attached simulated data.

The report also comes with tests to see whether they are from the same distribution.

See Documentation: Life Distribution - Compare Groups
- Mark as New
- Bookmark
- Subscribe
- Mute
- Subscribe to RSS Feed
- Get Direct Link
- Report Inappropriate Content
Re: How to quantitatively compare particle distributions??
This is great, peng_liu. I finally managed to replicate your script with my (monstrous) data set, but how do I get the group homogeneity tests? Thanks!
- Mark as New
- Bookmark
- Subscribe
- Mute
- Subscribe to RSS Feed
- Get Direct Link
- Report Inappropriate Content
Re: How to quantitatively compare particle distributions??
It is not far below the main plot. The outline node is closed by default. You need to open it to see the content.

- Mark as New
- Bookmark
- Subscribe
- Mute
- Subscribe to RSS Feed
- Get Direct Link
- Report Inappropriate Content
Re: How to quantitatively compare particle distributions??
Hi @seismicfish ,
for starters i would stack the data, then you should have one column with the particle size and the other with the location (GS31, Gs32 and GS35). with that you can use some of the options in the Fit Y by X platform including densities and other visual options. Otherwise, the stacked data is also more useful in the graph builder.
send us a data sample if you want some inspiration.
ron
- Mark as New
- Bookmark
- Subscribe
- Mute
- Subscribe to RSS Feed
- Get Direct Link
- Report Inappropriate Content
Re: How to quantitatively compare particle distributions??
Sounds good as I am not quite sure what you are explaining. Here are some data to play with. Thanks!
- Mark as New
- Bookmark
- Subscribe
- Mute
- Subscribe to RSS Feed
- Get Direct Link
- Report Inappropriate Content
Re: How to quantitatively compare particle distributions??
- Mark as New
- Bookmark
- Subscribe
- Mute
- Subscribe to RSS Feed
- Get Direct Link
- Report Inappropriate Content
Re: How to quantitatively compare particle distributions??
These could be very helpful. Thank you. How did you translate all the data into a single column for both files though?

- Mark as New
- Bookmark
- Subscribe
- Mute
- Subscribe to RSS Feed
- Get Direct Link
- Report Inappropriate Content
Re: How to quantitatively compare particle distributions??
- Mark as New
- Bookmark
- Subscribe
- Mute
- Subscribe to RSS Feed
- Get Direct Link
- Report Inappropriate Content
Re: How to quantitatively compare particle distributions??
Dang. The FDE looks like it may be the ticket but unfortunately I don't have JMP Pro, just standard. Thanks though.
Recommended Articles
- © 2026 JMP Statistical Discovery LLC. All Rights Reserved.
- Terms of Use
- Privacy Statement
- Contact Us