- Don’t miss your chance to experience Discovery Summit Europe at our best available rate! Early bird registration through 31 Oct.
- Graph Builder Toolbar streamlines interactive graphing. Creates shortcuts on Report and GraphBuilder Helpers toolbars. Download and install the extension.
- Subscribe to RSS Feed
- Mark Topic as New
- Mark Topic as Read
- Float this Topic for Current User
- Bookmark
- Subscribe
- Mute
- Printer Friendly Page
Discussions
Solve problems, and share tips and tricks with other JMP users.- User Community
- :
- Discussions
- :
- How to order the x-axis of a Oneway Analyis by another column?

- Mark as New
- Bookmark
- Subscribe
- Mute
- Subscribe to RSS Feed
- Get Direct Link
- Report Inappropriate Content
How to order the x-axis of a Oneway Analyis by another column?
Hey all,
I have a typical JSL that makes graphs from a table with X-Y Oneway Analysis that defaults to ordering the X axis alphabetical/numerical.
On my graphs I want the top most value(in the table) to be the furthest to the right on my plots. I have been right clicking then "Edit Value Order" to do this, but I would like to incorporate it in my JSL for my colleagues to be able to use as well.
I went into Scripting help but was lost as to how I would set Row Order Levels in JSL.


- Mark as New
- Bookmark
- Subscribe
- Mute
- Subscribe to RSS Feed
- Get Direct Link
- Report Inappropriate Content
Re: How to order the x-axis of a Oneway Analyis by another column?
You can see how to set the different Column Properties by setting them interactively, and then using
<< get Property()
retrieve what is required to use
<< set Property()
to use JSL to assign the values
So I set the order for the lot_id column interactively
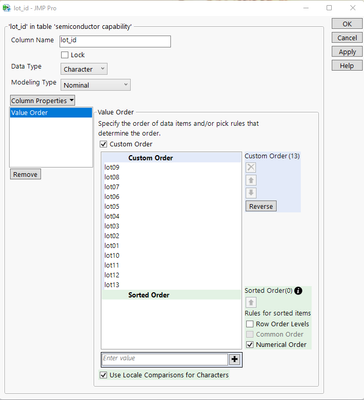
I then ran this script to get the structure required for the Value Ordering column property
names default to here(1);
dt=current data table();

orderList = dt:lot_id << get property("Value Order");

show(orderList);
it returned
orderList = {Custom Order({"lot09", "lot08", "lot07", "lot06", "lot05", "lot04", "lot03", "lot02", "lot01", "lot10", "lot11", "lot12", "lot13"}), Common Order(0)};
Therefore, the JSL required to set the Value Order property is
dt:lot_id << set property("Value Order", {Custom Order({"lot09", "lot08", "lot07",
"lot06", "lot05", "lot04", "lot03", "lot02",
"lot01", "lot10", "lot11", "lot12", "lot13"}), Common Order(0)});

- Mark as New
- Bookmark
- Subscribe
- Mute
- Subscribe to RSS Feed
- Get Direct Link
- Report Inappropriate Content
Re: How to order the x-axis of a Oneway Analyis by another column?
Hi @Hobbi ,
@txnelson gave you the exact correct answer.
Yet, the best ordering options for an axis in a graph are available in Graph builder. There, you can order a categorical axis by a variety of summary statistics of other variables. as in the pictures.
Let us know if it works in for your application.


Recommended Articles
- © 2026 JMP Statistical Discovery LLC. All Rights Reserved.
- Terms of Use
- Privacy Statement
- Contact Us