- New to JMP? Join us Sept. 23-24 for the Early User Edition of Discovery Summit, tailor-made for new users. Register now for free!
- Your voice matters! Tell us how you prefer to receive JMP updates, so we can tailor our communication to your needs. Take short survey.
- See how to access JMP Marketplace - and - find, create & share add-ins to extend your JMP. Watch video.
- Subscribe to RSS Feed
- Mark Topic as New
- Mark Topic as Read
- Float this Topic for Current User
- Bookmark
- Subscribe
- Mute
- Printer Friendly Page
Discussions
Solve problems, and share tips and tricks with other JMP users.- JMP User Community
- :
- Discussions
- :
- How to make a scatter line plot instead of the scatter dot plot

- Mark as New
- Bookmark
- Subscribe
- Mute
- Subscribe to RSS Feed
- Get Direct Link
- Report Inappropriate Content
How to make a scatter line plot instead of the scatter dot plot
Hi folks,
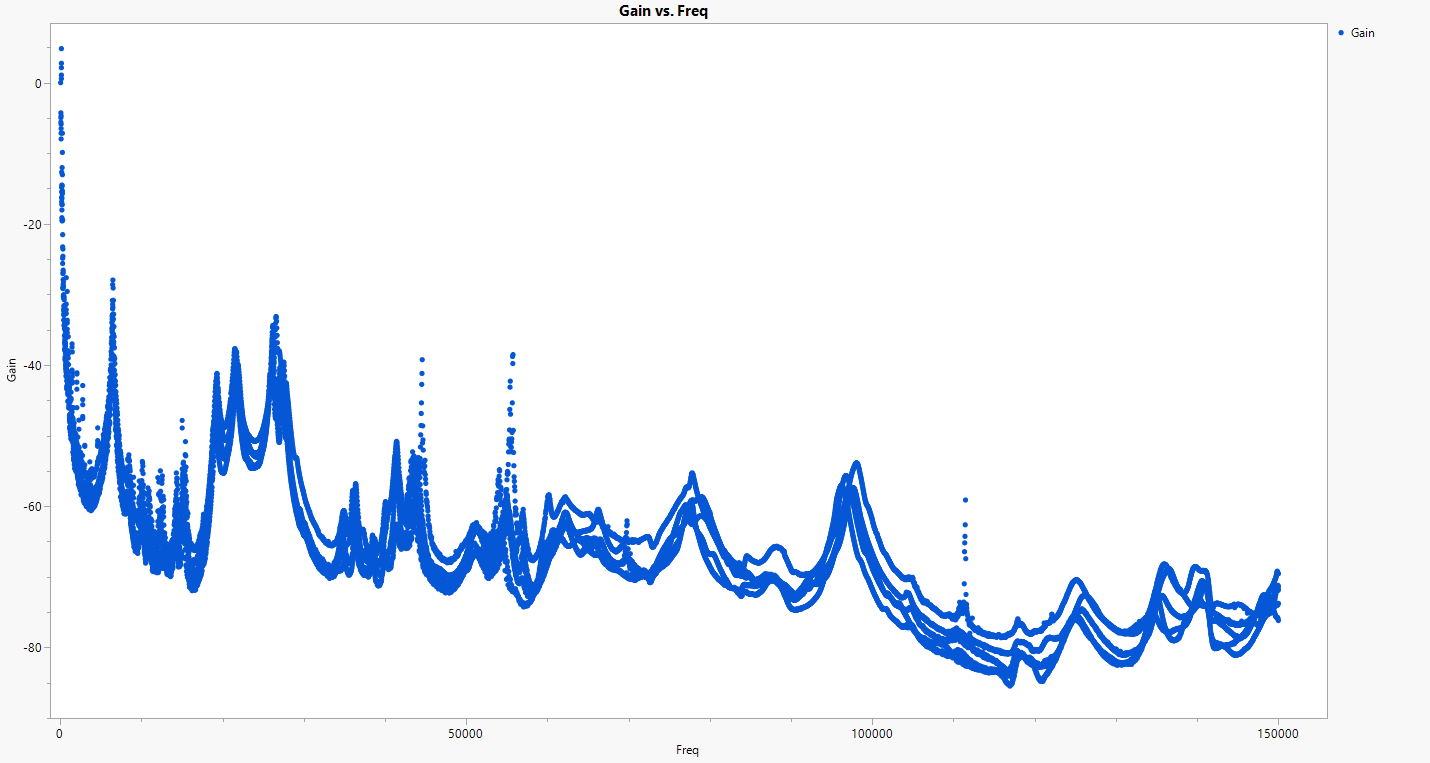
I have a data table with the data of 5 parts, how can I make the line plot instead of the dot plot shown below. The dot plot looks broken and think a smooth line replace those dots would be preferred in my case. I am attaching the data table and appreciate if you can paste a JSL to enable the line plot. Thank you.

Accepted Solutions

- Mark as New
- Bookmark
- Subscribe
- Mute
- Subscribe to RSS Feed
- Get Direct Link
- Report Inappropriate Content
Re: How to make a scatter line plot instead of the scatter dot plot
Not sure whether the following is what you want to achieve:

This is Gain vs Freq, overlaid by Part. To get it interactively, assuming you are using Graph Builder, select the Lines icons (in yellow), and grab and drop Part to "overlay" (in green).

And this is the resulting codes:
Graph Builder(
	Size( 533, 456 ),
	Show Control Panel( 0 ),
	Variables( X( :Freq ), Y( :Gain ), Overlay( :Part ) ),
	Elements( Line( X, Y, Legend( 9 ) ) )
);
- Mark as New
- Bookmark
- Subscribe
- Mute
- Subscribe to RSS Feed
- Get Direct Link
- Report Inappropriate Content
Re: How to make a scatter line plot instead of the scatter dot plot
Not sure whether the following is what you want to achieve:
This is Gain vs Freq, overlaid by Part. To get it interactively, assuming you are using Graph Builder, select the Lines icons (in yellow), and grab and drop Part to "overlay" (in green).
And this is the resulting codes:
Graph Builder(
	Size( 533, 456 ),
	Show Control Panel( 0 ),
	Variables( X( :Freq ), Y( :Gain ), Overlay( :Part ) ),
	Elements( Line( X, Y, Legend( 9 ) ) )
);
- Mark as New
- Bookmark
- Subscribe
- Mute
- Subscribe to RSS Feed
- Get Direct Link
- Report Inappropriate Content
Re: How to make a scatter line plot instead of the scatter dot plot
Hi Peng,
Thank you. But when I look at it closely, this is not what I am looking for. I know how to do the part-to-part overlay and then the line plot like what you recommended. My case is that we don't want to overlay the parts, we have other "type" to overlay. For example, we will have modeling result and testing result which has 5 parts, and we would like to overlay the modeling and testing with different color, and we would like to make a line plot in my original post. Please help advise it. Thank you.
- Mark as New
- Bookmark
- Subscribe
- Mute
- Subscribe to RSS Feed
- Get Direct Link
- Report Inappropriate Content
Re: How to make a scatter line plot instead of the scatter dot plot
If you want each part has its own line, then overlay is necessary. I guess you might have already tried to remove overlay, and the result is an average of all parts:

If only different colors bother you, maybe you can try changing to a single color, and over lay other things with other colors:

- Mark as New
- Bookmark
- Subscribe
- Mute
- Subscribe to RSS Feed
- Get Direct Link
- Report Inappropriate Content
Re: How to make a scatter line plot instead of the scatter dot plot
Hi Peng,
I don't want to plot the mean as the line plot, I would like to plot each part as a line plot without using part color overlay. Anyway, I will re-open this question in another thread to better describe my question. Thank you for looking into it.
- Mark as New
- Bookmark
- Subscribe
- Mute
- Subscribe to RSS Feed
- Get Direct Link
- Report Inappropriate Content
Re: How to make a scatter line plot instead of the scatter dot plot
Another try, but you need to change data format. I attach the needed data format. It is obtained by Split:

Then put all "part" columns to Y, and "freq" to X, and get this. And you can certain change legend colors if you don't want different colors.

Recommended Articles
- © 2026 JMP Statistical Discovery LLC. All Rights Reserved.
- Terms of Use
- Privacy Statement
- Contact Us