- Don’t miss your chance to experience Discovery Summit Europe at our best available rate! Early bird registration through 31 Oct.
- Graph Builder Toolbar streamlines interactive graphing. Creates shortcuts on Report and GraphBuilder Helpers toolbars. Download and install the extension.
- Subscribe to RSS Feed
- Mark Topic as New
- Mark Topic as Read
- Float this Topic for Current User
- Bookmark
- Subscribe
- Mute
- Printer Friendly Page
Discussions
Solve problems, and share tips and tricks with other JMP users.- User Community
- :
- Discussions
- :
- Re: How to get box plot overlayed with dot plot for selected groups?

- Mark as New
- Bookmark
- Subscribe
- Mute
- Subscribe to RSS Feed
- Get Direct Link
- Report Inappropriate Content
How to get box plot overlayed with dot plot for selected groups?
I understand that after generating the box plot in graph builder, right-click the graph, select add, then select points will display dot plots over a box plot.
However, I have a single graph displaying 3 box plots for 3 groups:A, B and C.
Group A is a large sample size so the box plot alone is sufficient, however, Group B and C has such as small sample size.
Therefore, I would like to overlay two box plots (Group B and C) with dots.
Currently, the above method applies dot plots to all groups.
So, I would like to find out ways to have dot plot on selected box plots.
Also, is there any function that changes the color for 'outlier' dots?
Thank you for your help in advance.
Accepted Solutions


- Mark as New
- Bookmark
- Subscribe
- Mute
- Subscribe to RSS Feed
- Get Direct Link
- Report Inappropriate Content
Re: How to get box plot overlayed with dot plot for selected groups?
Here's an approach...
First, however, is that to display both a box plot and individual points, you simply need to select both the box plot and the points symbol in the palette at the top of the graph builder. Same result as "right-clicking" and choosing "add points".
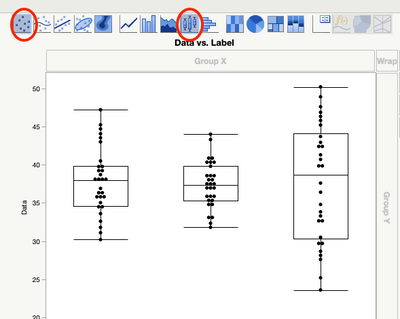
Re: showing dots only on selected box plots.
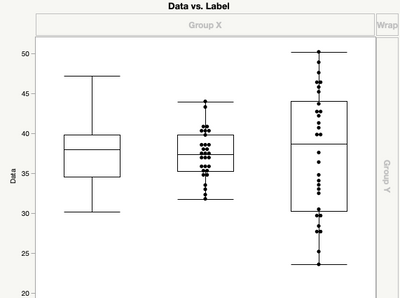
1. Highlight the points you don't want to display.
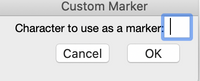
2. Right-click and choose Rows > Row Markers > Other
3. In the field that appears for you to type in the marker you wish to use, insert a space via the "space-bar" on your keyboard.
Re: different colors for outliers
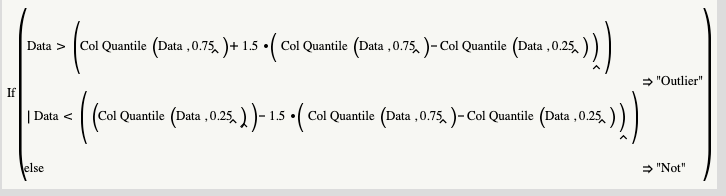
You can create an indicator variable via a formula identifying if a data value is an outlier or not. Then you can choose unique colors/symbols for each of the groups ("Outlier" or "Not")
Example if you were doing the standard Outlier if it exceeds 1.5*IQR beyond the Q1 or Q3.
- Mark as New
- Bookmark
- Subscribe
- Mute
- Subscribe to RSS Feed
- Get Direct Link
- Report Inappropriate Content
Re: How to get box plot overlayed with dot plot for selected groups?
Here's an approach...
First, however, is that to display both a box plot and individual points, you simply need to select both the box plot and the points symbol in the palette at the top of the graph builder. Same result as "right-clicking" and choosing "add points".
Re: showing dots only on selected box plots.
1. Highlight the points you don't want to display.
2. Right-click and choose Rows > Row Markers > Other
3. In the field that appears for you to type in the marker you wish to use, insert a space via the "space-bar" on your keyboard.
Re: different colors for outliers
You can create an indicator variable via a formula identifying if a data value is an outlier or not. Then you can choose unique colors/symbols for each of the groups ("Outlier" or "Not")
Example if you were doing the standard Outlier if it exceeds 1.5*IQR beyond the Q1 or Q3.
- Mark as New
- Bookmark
- Subscribe
- Mute
- Subscribe to RSS Feed
- Get Direct Link
- Report Inappropriate Content
Re: How to get box plot overlayed with dot plot for selected groups?
Recommended Articles
- © 2026 JMP Statistical Discovery LLC. All Rights Reserved.
- Terms of Use
- Privacy Statement
- Contact Us