- Don’t miss your chance to experience Discovery Summit Europe at our best available rate! Early bird registration through 31 Oct.
- Graph Builder Toolbar streamlines interactive graphing. Creates shortcuts on Report and GraphBuilder Helpers toolbars. Download and install the extension.
- Subscribe to RSS Feed
- Mark Topic as New
- Mark Topic as Read
- Float this Topic for Current User
- Bookmark
- Subscribe
- Mute
- Printer Friendly Page
Discussions
Solve problems, and share tips and tricks with other JMP users.- User Community
- :
- Discussions
- :
- How to generate capability box plots for multiple process qualities?

- Mark as New
- Bookmark
- Subscribe
- Mute
- Subscribe to RSS Feed
- Get Direct Link
- Report Inappropriate Content
How to generate capability box plots for multiple process qualities?
Hi,
I have the data table set-up as attached where my end goal is to generate the cpk/ppk values for each grade based on numerous quality (in this case density, roughness and strength) and also generate the process capability box plots.
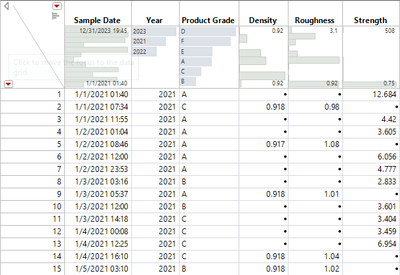
I am able to generate those in 'process screening' however unable to do the same using process capability platform in the 'analyze' section. I've successfully done it previously however there were multiple additional steps needed to get there (i.e create subsets and split the table first) which to me is inefficient if I have > 10 grades and > 10 qualities to be analyzed.
Just by using the existing data table format that I have right now and the spec limits table, is there a way for me to get the same result?
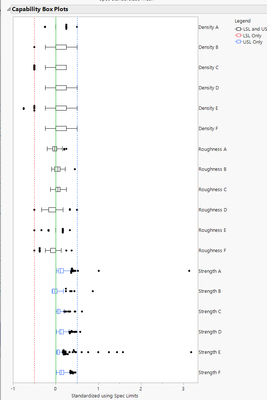
Capability box plots that I wanted (example for roughness):
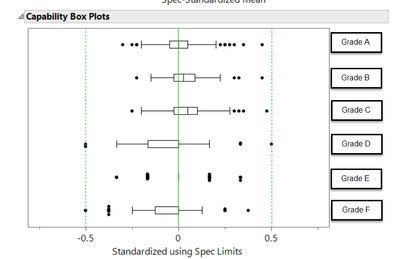
Thank you!
Accepted Solutions


- Mark as New
- Bookmark
- Subscribe
- Mute
- Subscribe to RSS Feed
- Get Direct Link
- Report Inappropriate Content
Re: How to generate capability box plots for multiple process qualities?
You need to have Variable column in your Spec Limits table (Combine Quality and Product Grade in this order)
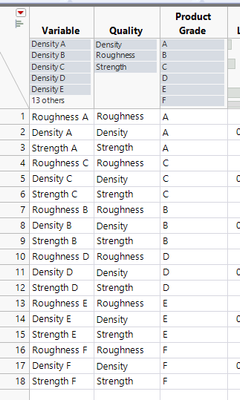
Formula:
:Quality || " " || :Product GradeThen you have to split your data
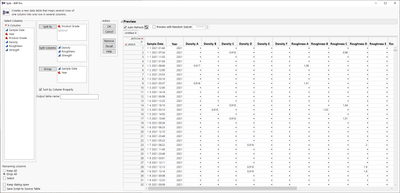
After that go to Manage Limits (I think JMP17.2 isn't able to capture this part properly) and Load from limits table and save to column properties
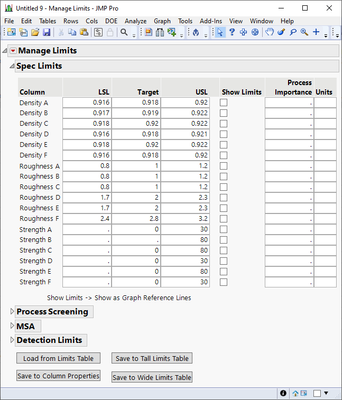
after this you can run Process Capability
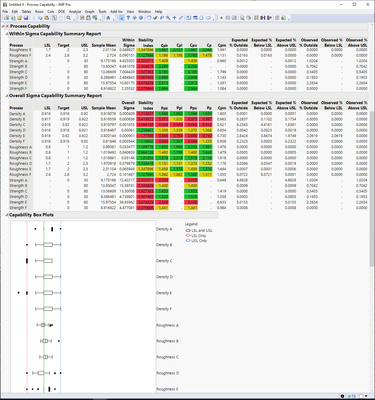
Table attached with table script to re-create process capability. Workflow is also attached but it doesn't work due to the issues with Manage Limits
- Mark as New
- Bookmark
- Subscribe
- Mute
- Subscribe to RSS Feed
- Get Direct Link
- Report Inappropriate Content
Re: How to generate capability box plots for multiple process qualities?
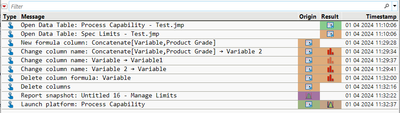
I don't think you can do it easily with your exact data format. If you have been able to do it previously, you could maybe create a workflow or get the script from Enhanced Log to reproduce your steps. Doing this doesn't really require too many steps BUT it does require some modifications to your data (split your results, add new column to specs and remove few other columns, set spec limits and run the platform)
Other option could be to calculate your Cpk/Ppk using Process Screening and then use Graph Builder to create those boxplots but this would still require you to modify how your data is formatted.
This is one thing I consider JMP to be lacking (difference between quality/process platforms). Some platforms are awesome (like Process Screening) and work with different data formats and other (Process Capability, MSA) quickly end up requiring you to write your own add-ins/scripts to perform seemingly simple tasks (at least I have done it to avoid many issues JMP has with our data formats).
- Mark as New
- Bookmark
- Subscribe
- Mute
- Subscribe to RSS Feed
- Get Direct Link
- Report Inappropriate Content
Re: How to generate capability box plots for multiple process qualities?
Thank you for this! Are you able to share the modified JMP file that you have?
Are there any other data formatting method that would work better for this? I'm trying to have one data table (or at least as few as possible) to work with as opposed to 2 - 3 new ones created that you get when you start splitting tables.
- Mark as New
- Bookmark
- Subscribe
- Mute
- Subscribe to RSS Feed
- Get Direct Link
- Report Inappropriate Content
Re: How to generate capability box plots for multiple process qualities?
You need to have Variable column in your Spec Limits table (Combine Quality and Product Grade in this order)
Formula:
:Quality || " " || :Product GradeThen you have to split your data
After that go to Manage Limits (I think JMP17.2 isn't able to capture this part properly) and Load from limits table and save to column properties
after this you can run Process Capability
Table attached with table script to re-create process capability. Workflow is also attached but it doesn't work due to the issues with Manage Limits
- Mark as New
- Bookmark
- Subscribe
- Mute
- Subscribe to RSS Feed
- Get Direct Link
- Report Inappropriate Content
Re: How to generate capability box plots for multiple process qualities?
I tried out this method and very satisfied with the outcome. The manage limits function works on my JMP Pro too.
Really appreciate your help on this!
Recommended Articles
- © 2026 JMP Statistical Discovery LLC. All Rights Reserved.
- Terms of Use
- Privacy Statement
- Contact Us