cancel
Showing results for 
Show  only  | Search instead for 
Did you mean: 
  • Instantly extract effect sizes, F-ratios, and FDR-adjusted p-values from your models with the Calculate Effects Sizes extension, available now in the JMP Marketplace!
  • New to JMP? Join us Sept. 23-24 for the Early User Edition of Discovery Summit, tailor-made for new users. Register now for free!
  • See how to use the JMP Marketplace – Free tools to expand JMP capabilities. Register. July 10, 2 pm US Eastern Time.

Discussions

Solve problems, and share tips and tricks with other JMP users.
Choose Language Hide Translation Bar
Bingh94
Staff

How to display drag line graph values?

Hello,


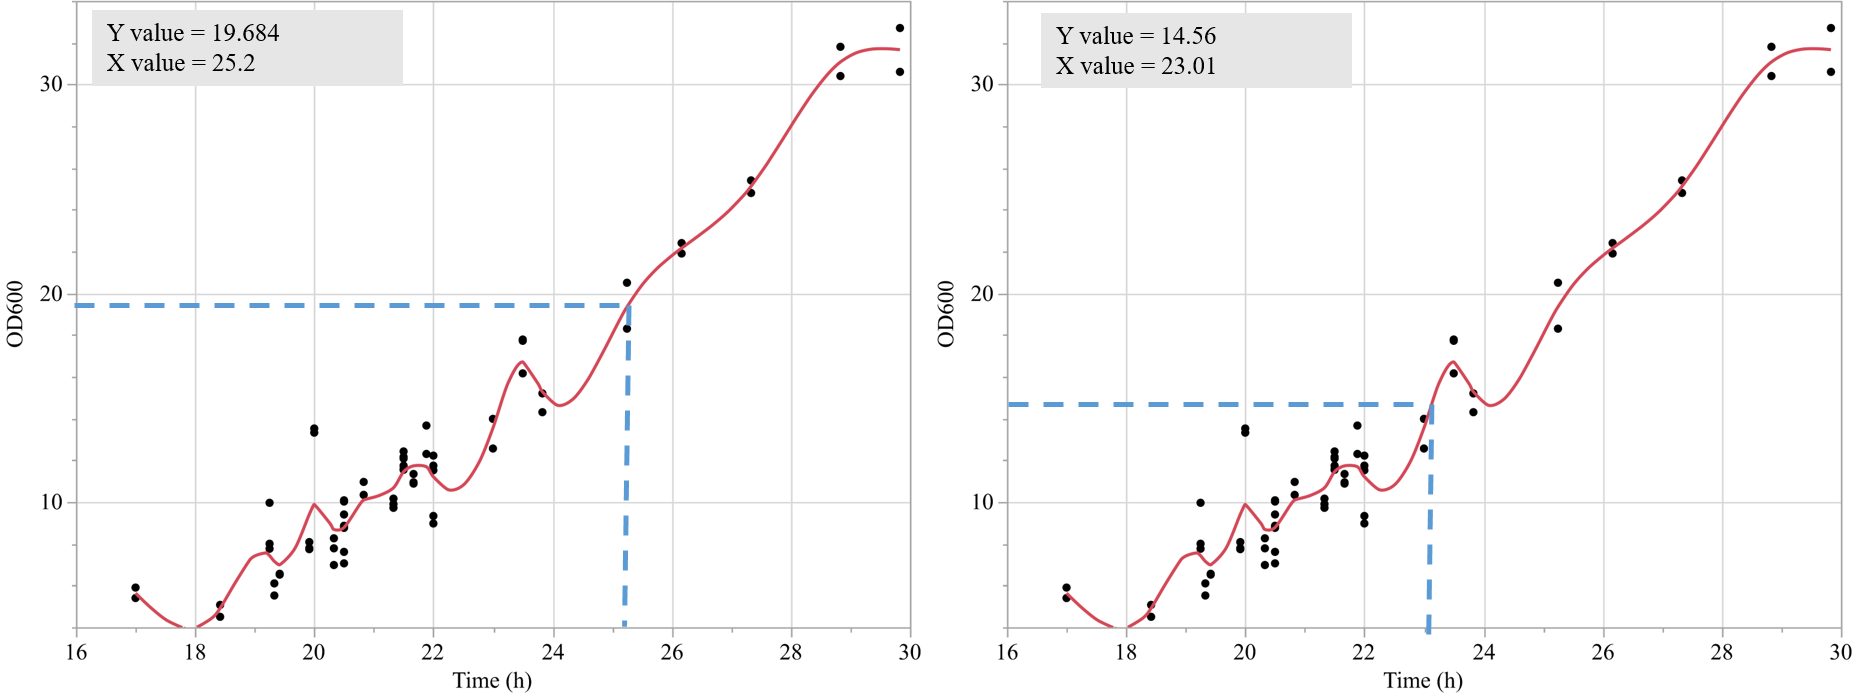
I'm hoping to be able to find a way to use the 'Drag line' customisation (see below) to be able to report the x and y-values that the line has been dragged onto so it's displayed onto the graph.


Drag line script:


If( Is Empty( g_x5 ),
    g_x5 = [25.03, 17.32, 18.81];
    g_y5 = [26.86, 25.62, 21.61];
);
Drag Line( g_x5, g_y5 );


If possible, I'm also hoping to make it so the x and y points are anchored onto the axis, allowing for the user to drag the reference line across the graph space and have it read out the intersecting values (see mock up photo attached).


Thanks!

Ben

1 REPLY 1
ian_jmp
Level X

Re: How to display drag line graph values?

Will the JMP Crosshairs tool do what you want? See, for example, the recording from @andreacoombs 

Recommended Articles