- Learn how to build custom Python data connectors and further customize JMP’s Data Connector Framework with the Python Data Connector Demo, available now in the JMP Marketplace!
- See how to use Accelerated Life Testing (ALT) to evaluate reliability. Register for June 5 webinar, 2pm US Eastern Time.
- Subscribe to RSS Feed
- Mark Topic as New
- Mark Topic as Read
- Float this Topic for Current User
- Bookmark
- Subscribe
- Mute
- Printer Friendly Page
Discussions
Solve problems, and share tips and tricks with other JMP users.- JMP User Community
- :
- Discussions
- :
- How to create categorization from data with with known categories for comparison...

- Mark as New
- Bookmark
- Subscribe
- Mute
- Subscribe to RSS Feed
- Get Direct Link
- Report Inappropriate Content
How to create categorization from data with with known categories for comparison and categorization of a new data run of unknown category
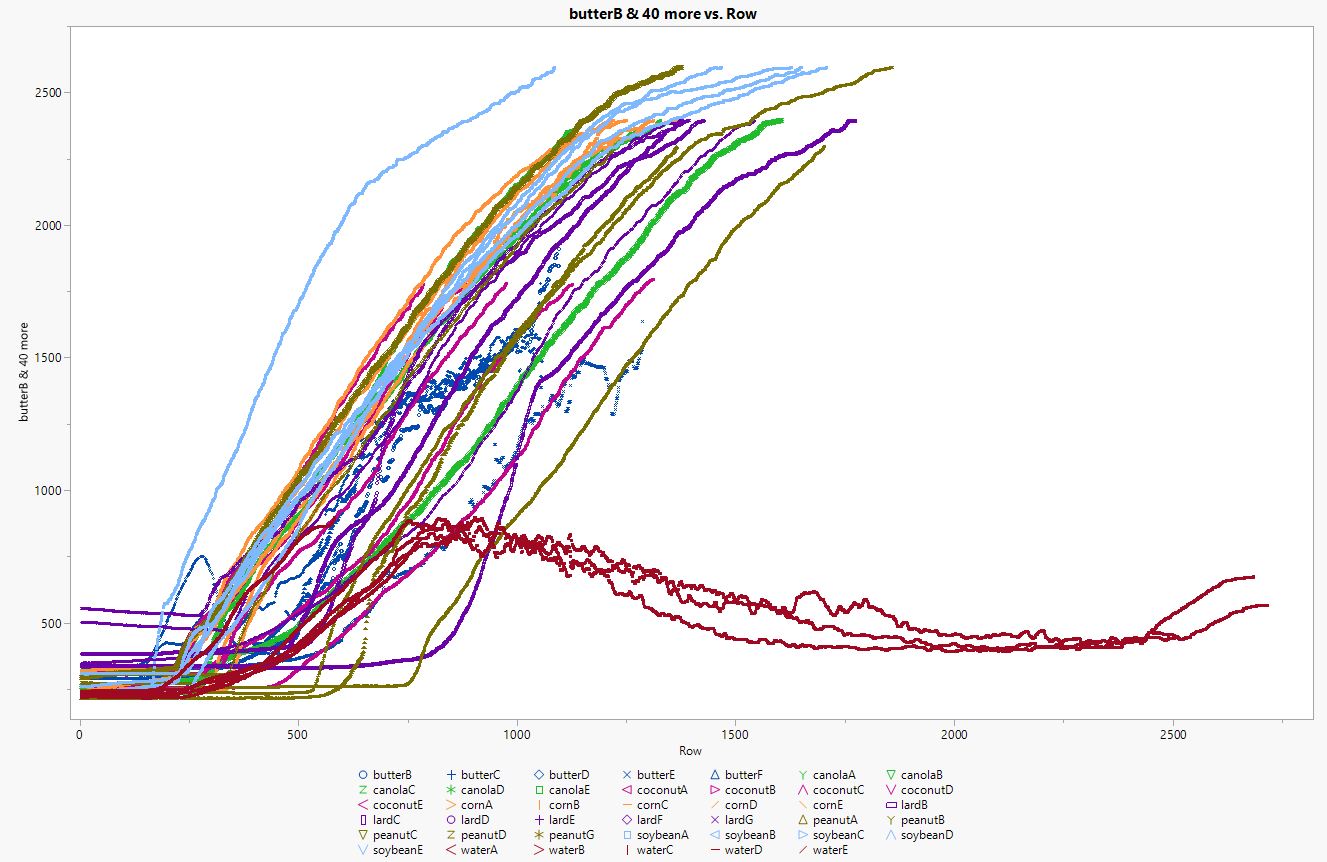
Scenario: I have 8 compounds A-H, for each compound I have 5 runs* of time-temperature data with a known category. I need to be able to compare a single data run of an unknown category to those existing runs and assign a category to that run.
A few things going on which may also need accounted for:
1) My start times (when heating began vs the data run started) do not all align.
2) Not all runs end at the same temperature (for safety reasons)
3) Some of these compounds are very similar and may not be distinguishable (whether I can or not is the purpose of this research)
I've attached my data as well as the image of the plot overlay.
I'm looking for help on what tool/function to use to go about setting this up. Right now, I can run things like analyze->multivariate to get a table with each data run against all the others, but this does not allow for comparing to the set of data. I also tried analyze - > cluster variables, but it only gives me two clusters and I don't know how to tell it to give me more. Nor can I see a way to manually train the initial clusters. Other options I tried appeared to be comparing individual row values, not the curve as a whole, which doesn't take into account the larger picture, which is what I need to be comparing.
I'm happy to dig deeper into the documentation on how to use the suggested tool/method/function, but I need advice on a starting place. I have access through my university so I should have access to most if not all options out there. I also have access to other analytics packages (including SAS) if there is a better option from one of those.
Scripts are ok, but I'd prefer not if possible since I'm new to JMP and under a time constraint.
*My focus right now is on getting a process in place that can at least separate out the obvious non-matches before I spend time and resources on additional data runs.

- Mark as New
- Bookmark
- Subscribe
- Mute
- Subscribe to RSS Feed
- Get Direct Link
- Report Inappropriate Content
Re: How to create categorization from data with with known categories for comparison and categorization of a new data run of unknown category
Welcome to the community. Here are my thoughts/questions:
I don't know what I'm looking at and don't understand the process enough to provide specific advice.
1. I don't see compounds A-H in the data table? I see what may be the components that make up the compounds? For example, Compound A may be some amount of each of the ingredients (Butter, Canola, coconut, corn, etc.) that you have as columns. You need to have a column in your data that contains the 8 different compounds. Apparently there should be a column for temperature? So, your first step is to set-up the data table appropriately. I think perhaps a column for each ingredient is OK, but not Butter A-F as separate columns.
2. What are the numbers in the table? What is (are) the response variable (s)? How much of a change in those response variables is of scientific interest?
3. Your time column should be formatted as a continuous numeric number.
I have added a script to create the plot you attached in Graph Builder. Just click on the Green arrow (Ingredients vs. time) below the Source in the upper left corner.
- Mark as New
- Bookmark
- Subscribe
- Mute
- Subscribe to RSS Feed
- Get Direct Link
- Report Inappropriate Content
Re: How to create categorization from data with with known categories for comparison and categorization of a new data run of unknown category
Thank you for the detailed response.
1) My compounds A - H are the "Butter", "Corn", etc. Each of them I have 5 test runs/columns for the data from heating that compound. I see you combined the butters with a median in your script, so you figured out the intention despite my poor description.
2) The data in those columns is the temperature in Cx10, so 450 = 45 degrees Celsius. I think the temperature should be the response variable as the heat input is constant as is the time between measurements. There isn't a specific change in the response that is of interest, what is of interest is whether the way it changes (the overall curve) matches the way other test runs of the same compound changed. Specifically, can I use the time-temperature data I have to identify which compound I'm heating. (Whether this is possible or not is the query being tested with the research.)
3) I'm not sure I understand the issue here, but your graph worked and mine didn't, so you're definitely correct that it's wrong. Did I need to strip off the seconds indicator?
I think with the script you included I can see where the errors I was having are located. I've also gotten several ideas to try from here.
Thank you!
- Mark as New
- Bookmark
- Subscribe
- Mute
- Subscribe to RSS Feed
- Get Direct Link
- Report Inappropriate Content
Re: How to create categorization from data with with known categories for comparison and categorization of a new data run of unknown category
I did change the type of data for time (it was categorical in your original table...don't put words in the column, in your case you had the unit of measure in the column (sec)). But you didn't answer my question regarding practical significance. The response is a curve which is fine. How much of a change in the curve is of practical significance? What is the most important aspect (s) of the curve (Max, min, slope, curve, etc.)?
- Mark as New
- Bookmark
- Subscribe
- Mute
- Subscribe to RSS Feed
- Get Direct Link
- Report Inappropriate Content
Re: How to create categorization from data with with known categories for comparison and categorization of a new data run of unknown category
The most important aspect is the overall shape of the curve itself. What I'm trying to do is show that because of the differences in specific heat between compounds, the heating curve over time will be unique enough to the compound in question (or to a chemically related set of compounds) to identify it (or them) based on the temperate data as it's heated. For example, the way in which water heats up given its heat capacity should be different than the way in which soybean oil heats up if the temperature input is constant because water requires more Joules to heat one degree than soybean oil does.
Then end goal here is to be able to change the "danger temperature" on a stovetop based on what is being heated rather than set to a constant maximum temperature which might be higher than the practical danger temperature of the item being cooked.
- Mark as New
- Bookmark
- Subscribe
- Mute
- Subscribe to RSS Feed
- Get Direct Link
- Report Inappropriate Content
Re: How to create categorization from data with with known categories for comparison and categorization of a new data run of unknown category
OK, makes sense, but how would you control this in the hands of the consumer? Give them directions to adjust the input temperature of the stove based on what they are cooking? This would require the consumer to read the manual. Good luck with that.
I would first be doing directed sampling over the different food types rather than DOE. You need a relatively large inference space as foods can vary significantly due to nature. With sampling you can establish greater confidence in the consistency of temperatures needed to reach the danger temperature. Then I would make the stove top temperature controls robust to the varying conditions of the food type. This may involve experimentation of design factors across extreme "levels" of changing food types.
- Mark as New
- Bookmark
- Subscribe
- Mute
- Subscribe to RSS Feed
- Get Direct Link
- Report Inappropriate Content
Re: How to create categorization from data with with known categories for comparison and categorization of a new data run of unknown category
Haha, yeah, I know the customer won't read the manual. The idea is that this device is connected directly to the stovetop, so the stovetop tells the software what heating input has been selected for electric/induction ranges or what gas pressure is being output for gas stoves (which is then a relatively simple math calculation to figure out Joules). The way you'd get initial data in terms of particular food types in a larger context is by working with test kitchens to have their stoves automatically record the data with each run of whatever they are test cooking. That's all waaaay outside the scope of my dissertation project though.
Thank you for your continued responses, I appreciate the insights. This sounds similar to what a friend suggested last night which is to break the readings down into 10 second segments then run linear regression and t-tests.
- Mark as New
- Bookmark
- Subscribe
- Mute
- Subscribe to RSS Feed
- Get Direct Link
- Report Inappropriate Content
Re: How to create categorization from data with with known categories for comparison and categorization of a new data run of unknown category
Sorry my bias is to real situations, real product designs, real use applications, etc. What exactly is your device doing? How does it know the food type or combinations of food types to send that information to the control system for the stove? I assume you will have to have some user input? Or are you developing a sensor that can detect food type? It seems you don't need a device, but a UI that asks the User to input the food type. The algorithms for how the stove modifies the amount of energy and cook time for each food type are loaded into the firmware. Of course there are still components of variation to consider (eg., measurement error, within pan, pan-to-pan within cooktop, Unit-to-unit)
Of course if you are in the real world, you must also be aware of the regulatory agency requirements. They specify maximum allowable temperatures recorded in surfaces adjacent to the stoves.
- Mark as New
- Bookmark
- Subscribe
- Mute
- Subscribe to RSS Feed
- Get Direct Link
- Report Inappropriate Content
Re: How to create categorization from data with with known categories for comparison and categorization of a new data run of unknown category
The goal is to design a device which can automatically detect the food type without user input. My hypothesis is that since different compounds have different heat capacities, they will react differently to heating. Which is something we can measure with a temperature sensor. With big data analysis (or AI which I was originally going to use, but have moved away from due to time constraints), we should now have the ability to measure this and respond to it in a useful way without user input. The idea is that even if I can't get an exact match (which is admittedly unrealistic), if we can get in the same ballpark to the extent that our danger temperatures are similar, we can dynamically adjust what that maximum temperature should be. So if you're using coconut oil with a much lower smoke point the stove treats it as different than say corn oil with a higher smoke point. I used cooking lipids to start with because they are relatively straightforward and the leading cause of kitchen fires. The industry does have maximum temperatures (I actually have measurements with the max for my one year old stovetop appearing as it automatically decreased the temperature and started cycling to keep the pan low enough.), but depending on what item is on the stovetop, those temperatures may be above the temperature where a danger to the user is present.
You are correct, the algorithm for what happens after the type is identified would be preprogrammed as well as that any real-world dataset would need to be much much larger than what I'm testing for this project. This would be nowhere near fast enough for a "life and safety" application, no software could do that, it's more like having lane assist on your car. There would be an option for user override should they want to (up to that legal max limit), but if the user just walks away from the stove and forgets it, then it would dynamically adjust to ensure whatever the compound is doesn't reach the flash point much less the auto ignition, or potentially in the case of some compounds like butter be able to keep the temperature low enough/even enough that it doesn't start to sputter and splash all over the place.
Thank you so much for your questions, it's good to get outside perspectives on what may not make sense with the way I've outlined it.
- Mark as New
- Bookmark
- Subscribe
- Mute
- Subscribe to RSS Feed
- Get Direct Link
- Report Inappropriate Content
Re: How to create categorization from data with with known categories for comparison and categorization of a new data run of unknown category
Thanks for your explanation. The idea sounds great, but execution would be a huge challenge.
You can ignore my Questions: The appliance industry is constantly trying the reduce their costs, how is it cost effective? Where would the temperature sensor be located? Who places the sensor in the food? How do you get consumers to place the sensor? How about cleanliness of the sensor? Is one sensor enough? Temperatures vary within pan, how would 1 sensor account for this? What if the pan is not centered on the energy source? What are the effects of ambient conditions? Different pan types/sizes? What if more than one burner on the cooktop is being used? How different are the heat capacities of these different compounds? What happens to the heat capacities when they are "mixtures"? Lessening the temperatures may increase cook time, is that what the consumer wants? Will the food being cooked taste the same with lower temp cooking? How do you measure sputter or splash? Is this affected by the amount of ingredients.
Recommended Articles
- © 2026 JMP Statistical Discovery LLC. All Rights Reserved.
- Terms of Use
- Privacy Statement
- Contact Us