- Subscribe to RSS Feed
- Mark Topic as New
- Mark Topic as Read
- Float this Topic for Current User
- Bookmark
- Subscribe
- Mute
- Printer Friendly Page
Discussions
Solve problems, and share tips and tricks with other JMP users.- JMP User Community
- :
- Discussions
- :
- Re: How to convert 3 columns in one table

- Mark as New
- Bookmark
- Subscribe
- Mute
- Subscribe to RSS Feed
- Get Direct Link
- Report Inappropriate Content
How to convert 3 columns in one table
Hi all,
I am reaching out to get some help on a data process problem. Some time ago, I could convert 3 columns (load pH, load NaCl, Protein % in Load Wash) in one table : since it was very helpful, I would like to do the same thing with a new experiment. Unfortunately, I don’t remember how I did it before. You can have a look at the screenshots enclosed to have a better understanding of what I want to obtain.
I use JMP 17.0.0.
Thank you very much in advance!
Original data:

Table obtained :

Accepted Solutions

- Mark as New
- Bookmark
- Subscribe
- Mute
- Subscribe to RSS Feed
- Get Direct Link
- Report Inappropriate Content
Re: How to convert 3 columns in one table
The script I provided was based upon having the Column Property "Value Colors" set. Apparently your starting data table does not have them set.
I have changed the JSL to use the "Gradient Colors" Column Property. I also changed the code to set the "Color Gradient" on the initial data table, so it now ensures that when the new data table is being created, that it has what it needs to set the colors for the cells.
Names Default To Here( 1 );
dt = Current Data Table();

// Set the color gradient column property
dt:binding proportion << set property("color gradient", {"Green Yellow Red"(1), Range( {6.2, 87.38, 25.6941666666667} )});
dt:binding proportion<<color cell by value;

// Use Tabulate to create the transformed table
(tab = dt << Tabulate(
	Change Item Label( Statistics( Mean, " " ) ),
	Remove Column Label( Analysis Columns( Binding proportion ) ),
	Add Table(
		Column Table( Grouping Columns( :pH ), Statistics( Mean ), Analysis Columns( :Binding proportion ) ),
		Row Table( Grouping Columns( :"[NaCl]"n ) )
	)
)) << Make Into Data Table;

Current Data Table() << set name( "Final" );
dtFinal = Current Data Table();
Report( tab ) << close window;

// change column names and set the Color Gradient
valColors = dt:Binding proportion << get property("Color gradient");
For( i = 2, i <= N Cols( dtFinal ), i++,
	Column( dtFinal, i ) << set name( Word( -1, Trim( Column( dtFinal, i ) << get name ), "()," ) );
	Column( dtFinal, i ) << set property("Color Gradient", eval(valColors));
	Column(dtFinal,i)<<color cell by value;
	Column(dtFinal,i)<<set display width(40);
);- Mark as New
- Bookmark
- Subscribe
- Mute
- Subscribe to RSS Feed
- Get Direct Link
- Report Inappropriate Content
Re: How to convert 3 columns in one table
Your sample data is not in a readable form, please attach a copy of your original data to aid in responding to your issue.
- Mark as New
- Bookmark
- Subscribe
- Mute
- Subscribe to RSS Feed
- Get Direct Link
- Report Inappropriate Content
Re: How to convert 3 columns in one table
For example here, I would like to have the different pH values on the top, the NaCl values on the right and the "binding proportion" values in the table.
- Mark as New
- Bookmark
- Subscribe
- Mute
- Subscribe to RSS Feed
- Get Direct Link
- Report Inappropriate Content
Re: How to convert 3 columns in one table
Also, last time, the color gradient was directly transferred in the table. Which is not the case when I use the "Tables > Summary" feature.

- Mark as New
- Bookmark
- Subscribe
- Mute
- Subscribe to RSS Feed
- Get Direct Link
- Report Inappropriate Content
Re: How to convert 3 columns in one table
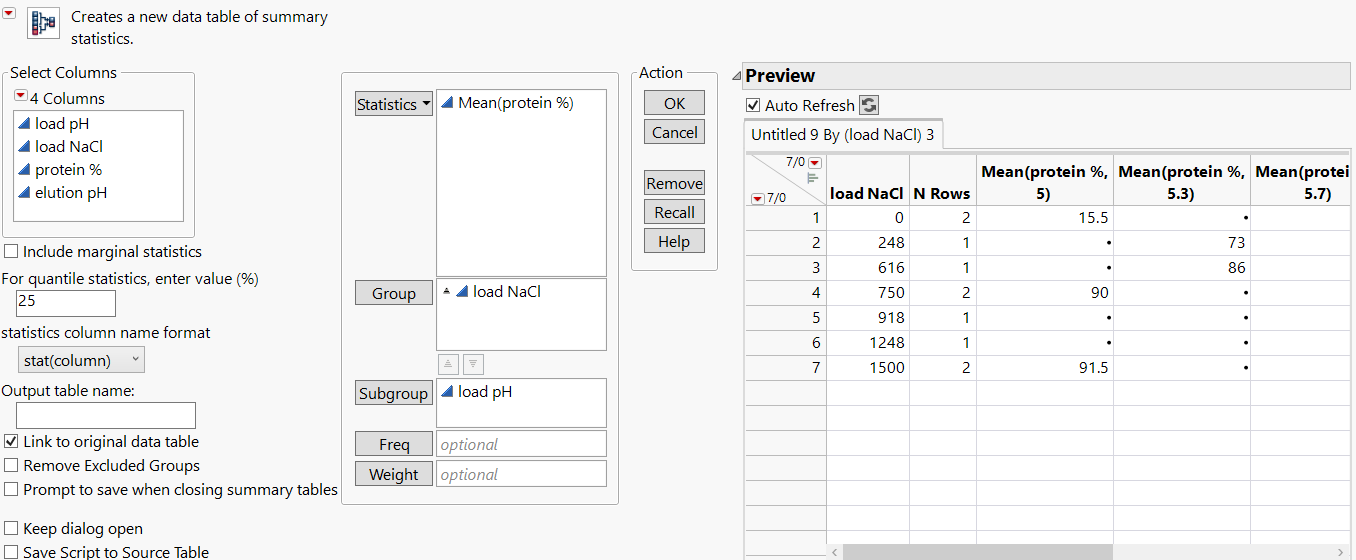
From "Tables" select "Summary"
Then set as as shown in the screen shot
Statistics - Mean (Protein%)
Group - load NaCl
Subgroup - load pH
I think that should result in the format you are looking for.
- Mark as New
- Bookmark
- Subscribe
- Mute
- Subscribe to RSS Feed
- Get Direct Link
- Report Inappropriate Content
Re: How to convert 3 columns in one table
Thank you for your reply!
It would work like this, but I cannot transfer the color gradient (set up in column info) to the table.
I am pretty sure that I used a different way to obtain this table last time but I don't remember how.
- Mark as New
- Bookmark
- Subscribe
- Mute
- Subscribe to RSS Feed
- Get Direct Link
- Report Inappropriate Content
Re: How to convert 3 columns in one table
Here is a simple script that transforms the data

Names Default To Here( 1 );
dt = Current Data Table();

// Use Tabulate to create the transformed table
(tab = dt << Tabulate(
	Change Item Label( Statistics( Mean, " " ) ),
	Remove Column Label( Analysis Columns( Binding proportion ) ),
	Add Table(
		Column Table( Grouping Columns( :pH ), Statistics( Mean ), Analysis Columns( :Binding proportion ) ),
		Row Table( Grouping Columns( :"[NaCl]"n ) )
	)
)) << Make Into Data Table;

Current Data Table() << set name( "Final" );
dtFinal = Current Data Table();
Report( tab ) << close window;

// change column names and set the Value Colors
valColors = dt:Binding proportion << get property("Value Colors");
For( i = 2, i <= N Cols( dtFinal ), i++,
	Column( dtFinal, i ) << set name( Word( -1, Trim( Column( dtFinal, i ) << get name ), "()," ) );
	Column( dtFinal, i ) << set property("Value Colors", eval(valColors));
	Column(dtFinal,i)<<color cell by value;
	Column(dtFinal,i)<<set display width(40);
);
Please do not just cut and paste this code, without taking the time to study it and learn what it is doing.
- Mark as New
- Bookmark
- Subscribe
- Mute
- Subscribe to RSS Feed
- Get Direct Link
- Report Inappropriate Content
Re: How to convert 3 columns in one table
Thank you very much!
I understand every line but I don't know where I should write in the color theme. I want to use "Yellow Green Red" gradient so I tried to replace "valColors" on line 22 by "Yellow Greed Red" but this is not it.
And when I run the script without changing anything this error message shows up:

- Mark as New
- Bookmark
- Subscribe
- Mute
- Subscribe to RSS Feed
- Get Direct Link
- Report Inappropriate Content
Re: How to convert 3 columns in one table
The script I provided was based upon having the Column Property "Value Colors" set. Apparently your starting data table does not have them set.
I have changed the JSL to use the "Gradient Colors" Column Property. I also changed the code to set the "Color Gradient" on the initial data table, so it now ensures that when the new data table is being created, that it has what it needs to set the colors for the cells.
Names Default To Here( 1 );
dt = Current Data Table();

// Set the color gradient column property
dt:binding proportion << set property("color gradient", {"Green Yellow Red"(1), Range( {6.2, 87.38, 25.6941666666667} )});
dt:binding proportion<<color cell by value;

// Use Tabulate to create the transformed table
(tab = dt << Tabulate(
	Change Item Label( Statistics( Mean, " " ) ),
	Remove Column Label( Analysis Columns( Binding proportion ) ),
	Add Table(
		Column Table( Grouping Columns( :pH ), Statistics( Mean ), Analysis Columns( :Binding proportion ) ),
		Row Table( Grouping Columns( :"[NaCl]"n ) )
	)
)) << Make Into Data Table;

Current Data Table() << set name( "Final" );
dtFinal = Current Data Table();
Report( tab ) << close window;

// change column names and set the Color Gradient
valColors = dt:Binding proportion << get property("Color gradient");
For( i = 2, i <= N Cols( dtFinal ), i++,
	Column( dtFinal, i ) << set name( Word( -1, Trim( Column( dtFinal, i ) << get name ), "()," ) );
	Column( dtFinal, i ) << set property("Color Gradient", eval(valColors));
	Column(dtFinal,i)<<color cell by value;
	Column(dtFinal,i)<<set display width(40);
);- Mark as New
- Bookmark
- Subscribe
- Mute
- Subscribe to RSS Feed
- Get Direct Link
- Report Inappropriate Content
Re: How to convert 3 columns in one table
Perfect, thanks a lot !
Recommended Articles
- © 2026 JMP Statistical Discovery LLC. All Rights Reserved.
- Terms of Use
- Privacy Statement
- Contact Us