- Subscribe to RSS Feed
- Mark Topic as New
- Mark Topic as Read
- Float this Topic for Current User
- Bookmark
- Subscribe
- Mute
- Printer Friendly Page
Discussions
Solve problems, and share tips and tricks with other JMP users.- JMP User Community
- :
- Discussions
- :
- Re: How to connect target points on different traces in an overlay plot?
- Mark as New
- Bookmark
- Subscribe
- Mute
- Subscribe to RSS Feed
- Get Direct Link
- Report Inappropriate Content
How to connect target points on different traces in an overlay plot?
Hi All!
I'm a new user in JMP software, and I was tasked to generate a plot and extract the script.
The plot I can generate now looks like below. I generated it from the Graph Builder. The four traces correspond to four different devices. The points on each trace show the voltage levels.
Each device has their own target voltage (For example: B: 1V, C: 0.9V, D: 0.65V). I would like to connect the target voltage point on each trace and calculate the delta_x and delta_y between them. Is there any way to achieve it in JMP? Also, can the calculated value appear on the plot as well? The plot I would like to create looks like this:
Thank you all in advance!
Accepted Solutions
- Mark as New
- Bookmark
- Subscribe
- Mute
- Subscribe to RSS Feed
- Get Direct Link
- Report Inappropriate Content
Re: How to connect target points on different traces in an overlay plot?
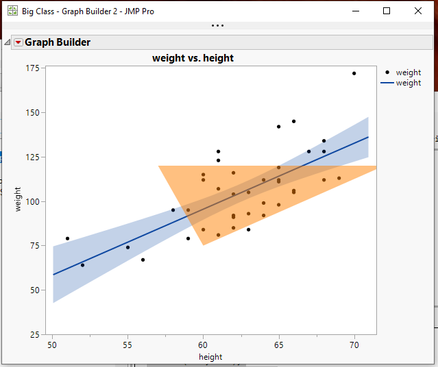
JMP has a full set of graphic primitives available to all graphical platforms. They allow you to add whatever items to a graphical display as desired. Lines, text, rectangles, polygons, colors, fill patterns, etc. are all available.
Here is the script for the above Graph Builder
Names Default To Here( 1 );
Open( "$SAMPLE_DATA/Big Class.jmp" );
gb = Graph Builder(
	Size( 534, 456 ),
	Show Control Panel( 0 ),
	Variables( X( :height ), Y( :weight ) ),
	Elements( Points( X, Y, Legend( 6 ) ), Line Of Fit( X, Y, Legend( 8 ) ) )
);
rgb = gb << report;
framebox = rgb[frame box( 1 )];
framebox << Add Graphics Script(
	Transparency( 0.5 );
	Fill Color( {1.0, 0.5, 0.0} );
	Polygon( [60, 72, 57], [75, 120, 120] );
);
The documentation for this methodology is found in the Scripting Guide in a section titled "Scripting Graphs".
Another, but not as elegant way to do this, would be to one or more of your Overlay groups. You could have A,B,C,D and Connect. You would add to your data table, the XY points for each of your A-D groups, and Graph Builder would draw them.
- Mark as New
- Bookmark
- Subscribe
- Mute
- Subscribe to RSS Feed
- Get Direct Link
- Report Inappropriate Content
Re: How to connect target points on different traces in an overlay plot?
Thanks for your response a lot! It helps a lot. I appreciate it!!!!
Recommended Articles
- © 2026 JMP Statistical Discovery LLC. All Rights Reserved.
- Terms of Use
- Privacy Statement
- Contact Us


