- Learn how to build custom Python data connectors and further customize JMP’s Data Connector Framework with the Python Data Connector Demo, available now in the JMP Marketplace!
- See how to create experiments to support product design and ID useful product features. Register for June 12 webinar, 2pm US Eastern Time.
- Subscribe to RSS Feed
- Mark Topic as New
- Mark Topic as Read
- Float this Topic for Current User
- Bookmark
- Subscribe
- Mute
- Printer Friendly Page
Discussions
Solve problems, and share tips and tricks with other JMP users.- JMP User Community
- :
- Discussions
- :
- How to change range of Group Y data in Graph Buildfer

- Mark as New
- Bookmark
- Subscribe
- Mute
- Subscribe to RSS Feed
- Get Direct Link
- Report Inappropriate Content
How to change range of Group Y data in Graph Buildfer
Group Y in a Graph Builder chart has grouped the data as ... 8-16, 16-24.... etc (Picture attached) whereas I want 20 to be a cut-off so that the effect can be shown of values <20 and >20. Is there a way to force JMP 13.2.1 to change the range, please? I have tried changing the 'Number of Levels..' but couldn't get 20 as the end of a range on Group Y.
Thanks

- Mark as New
- Bookmark
- Subscribe
- Mute
- Subscribe to RSS Feed
- Get Direct Link
- Report Inappropriate Content
Re: How to change range of Group Y data in Graph Buildfer
I believe the easiest way to do this is to create a new column using Recode that groups the "Number of Levels" into exactly the groupings you want. To use Recode, you will have to temporally change the Number of Levels column in to a character column, while you do the recoding since you will want the grouping values to be displayed as something like ">15 <= 20". Here is a simple example using the Big Class sample data table, where I have recoded the Height column into the groupings I want.


- Mark as New
- Bookmark
- Subscribe
- Mute
- Subscribe to RSS Feed
- Get Direct Link
- Report Inappropriate Content
Re: How to change range of Group Y data in Graph Buildfer
Thanks Nelson.
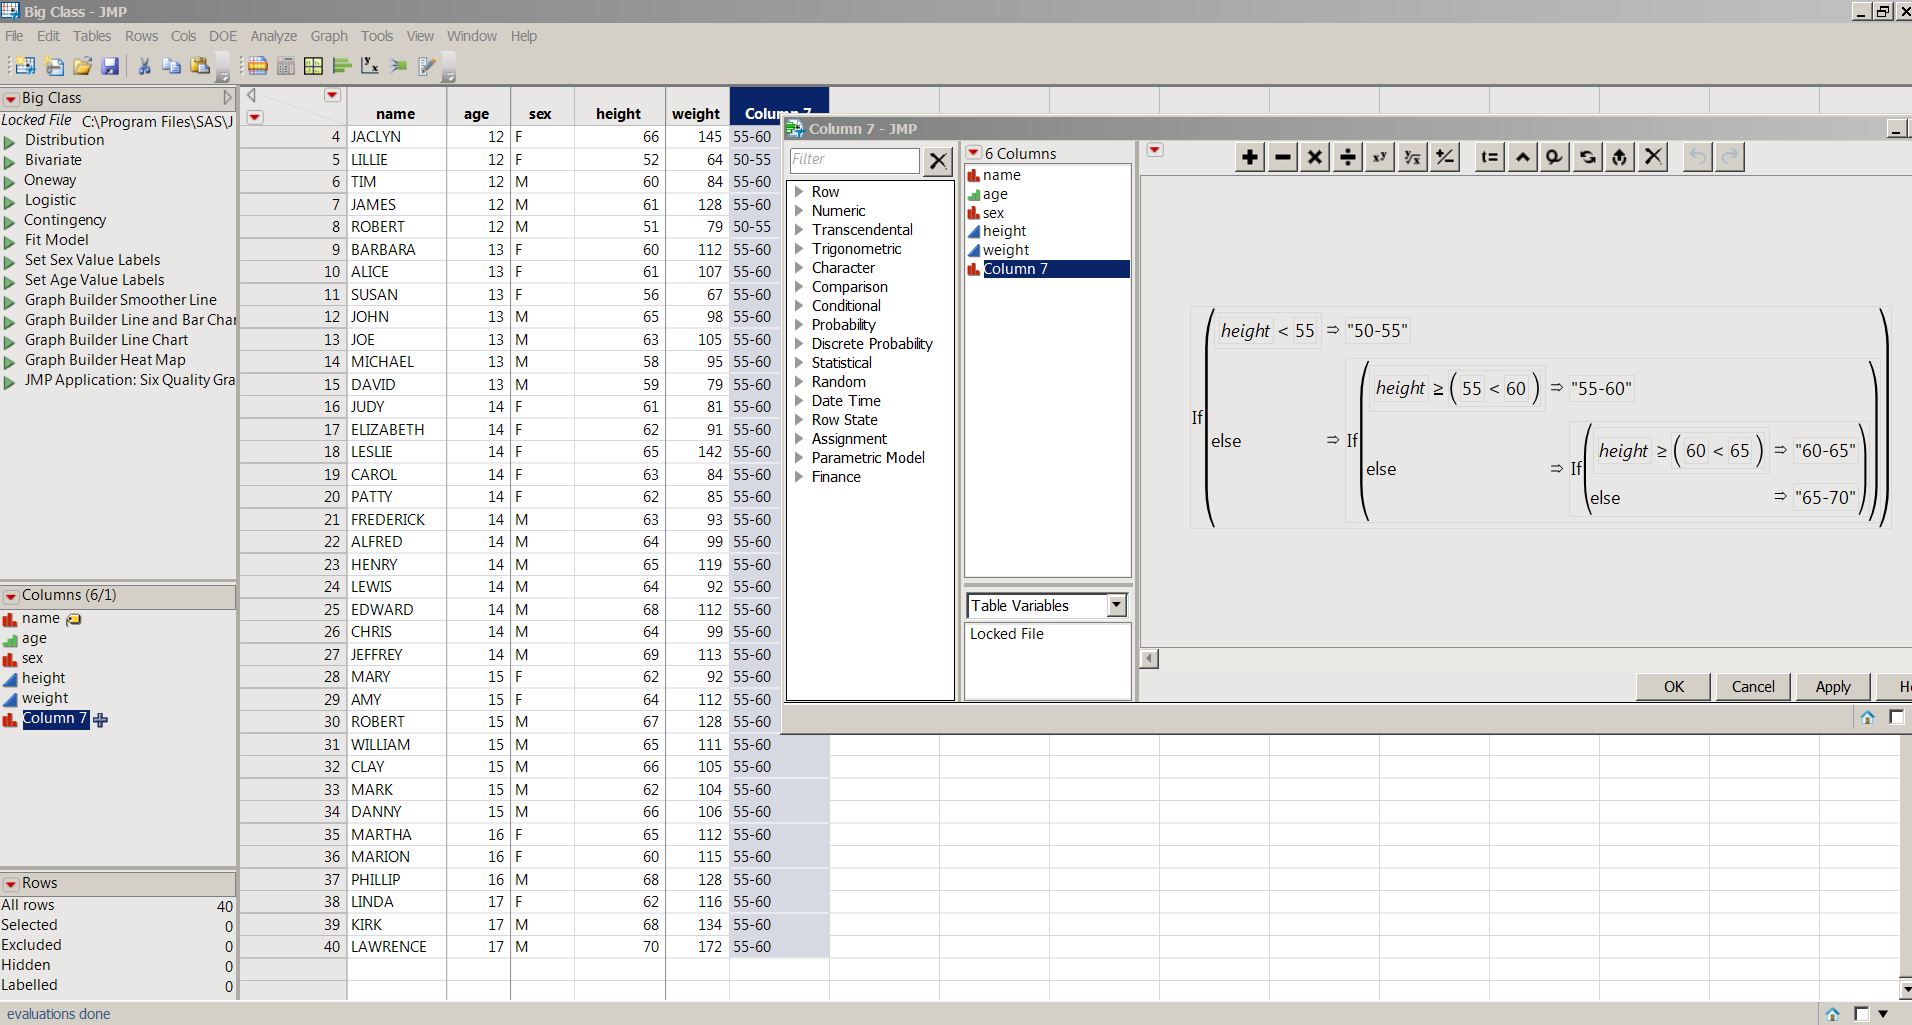
I could manually recode the data, but the manual recoding may be difficult for big data. As a different approach, I copied the column and tried to create a formula to create the groups, but the formula is only partially working for some reason (screenshot enclosed for BigClass data). Not sure if there is some mistake in the formula or if this approach is not possible. Thanks

- Mark as New
- Bookmark
- Subscribe
- Mute
- Subscribe to RSS Feed
- Get Direct Link
- Report Inappropriate Content
Re: How to change range of Group Y data in Graph Buildfer
If( :height < 55,
	"50-55",
	If( :height < 60,
		"55-60",
		If( :height < 65,
			"60-65",
			"65-70"
		)
	)
)
Not sure exactly why your formula doesnt work but this simpler formula should do the job.
Regards,
Phil
- Mark as New
- Bookmark
- Subscribe
- Mute
- Subscribe to RSS Feed
- Get Direct Link
- Report Inappropriate Content
Re: How to change range of Group Y data in Graph Buildfer
Thanks Phil.
The formula also worked after some correction (enclosed). I guess it was the 'first day at work' effect earlier.
Regards
- Mark as New
- Bookmark
- Subscribe
- Mute
- Subscribe to RSS Feed
- Get Direct Link
- Report Inappropriate Content
Re: How to change range of Group Y data in Graph Buildfer
A further simplification of the formula is:
If(
	:height < 55, "50-55",
	:height < 60, "55-60",
	:height < 65, "60-65",
	"65-70"
)Recommended Articles
- © 2026 JMP Statistical Discovery LLC. All Rights Reserved.
- Terms of Use
- Privacy Statement
- Contact Us