- Instantly extract effect sizes, F-ratios, and FDR-adjusted p-values from your models with the Calculate Effects Sizes extension, available now in the JMP Marketplace!
- New to JMP? Join us Sept. 23-24 for the Early User Edition of Discovery Summit, tailor-made for new users. Register now for free!
- Your voice matters! Tell us how you prefer to receive JMP updates, so we can tailor our communication to your needs. Take short survey.
- Subscribe to RSS Feed
- Mark Topic as New
- Mark Topic as Read
- Float this Topic for Current User
- Bookmark
- Subscribe
- Mute
- Printer Friendly Page
Discussions
Solve problems, and share tips and tricks with other JMP users.- JMP User Community
- :
- Discussions
- :
- How to add reference lines from a reference line table into a control charts or ...

- Mark as New
- Bookmark
- Subscribe
- Mute
- Subscribe to RSS Feed
- Get Direct Link
- Report Inappropriate Content
How to add reference lines from a reference line table into a control charts or variability charts?
Hello,
I am trying to create a table that holds the reference lines for each model. Each reference line is the yield expectation for each model. I intend to have a script that can import the reference lines from the central table and plot the reference line on the control charts or the variability charts when trending yields of each model.
Here is a my dummy data for the yield table
| Model | WaferID | Yield |
| IC1 | A | 50 |
| IC1 | B | 60 |
| IC1 | C | 70 |
| IC2 | E | 30 |
| IC2 | F | 40 |
| IC2 | G | 50 |
| IC2 | H | 60 |
| IC3 | R | 80 |
| IC3 | S | 90 |
| IC3 | T | 70 |
| IC3 | Z | 65 |
Here is my dummy reference line table that needs to be imported into the control charts
| Model | Reference line for Yield expectation |
| IC1 | 50 |
| IC2 | 45 |
| IC3 | 70 |
The control chart or the variablility chart I am trying to plot has "Yield" in y axis & "WaferID" as the x-axis. Hence I cannot use the "column property" function in the "Yield" column to set the reference lines. I have more than 60 ICs to look at and I looking fdor some help where it could be automated than manually entered. Here is a sample snap shot of what I am trying to achieve. Any help would be greatly appreciated.

Accepted Solutions

- Mark as New
- Bookmark
- Subscribe
- Mute
- Subscribe to RSS Feed
- Get Direct Link
- Report Inappropriate Content
Re: How to add reference lines from a reference line table into a control charts or variability char
The code below will produce:

and should get you started. You can use 'Help > Books > Scripting Guide' and 'Help > Scripting Index' to figure out what it's doing. Note that using the titles of the outline nodes is not currently very robust, but this could be improved, or done differently.
NamesDefaultToHere(1);

// Yield table
dt1 =
New Table( "Yield",
	Add Rows( 11 ),
	New Column( "Model",
		Character,
		"Nominal",
		Set Values(
			{"IC1", "IC1", "IC1", "IC2", "IC2", "IC2", "IC2", "IC3", "IC3", "IC3",
			"IC3"}
		)
	),
	New Column( "WaferID",
		Character( 16 ),
		"Nominal",
		Set Values( {"A", "B", "C", "E", "F", "G", "H", "R", "S", "T", "Z"} )
	),
	New Column( "Yield",
		Numeric,
		"Nominal",
		Format( "Best", 12 ),
		Set Values( [50, 60, 70, 30, 40, 50, 60, 80, 90, 70, 65] )
	)
);

// Reference table
dt2 =
New Table( "Reference",
	Add Rows( 3 ),
	New Column( "Model", Character, "Nominal", Set Values( {"IC1", "IC2", "IC3"} ) ),
	New Column( "Value",
		Numeric,
		"Nominal",
		Format( "Best", 12 ),
		Set Values( [50, 40, 70] )
	)
);

// Start here . . .
// Get the values in dt2 into lists for later
modelVal = Column(dt2, "Model") << getValues;
refVal = Column(dt2, "Value") << getValues;

// Control Charts
cc = dt1 << Control Chart(
						Sample Label( :WaferID ),
						Chart Col( :Yield, Individual Measurement ),
						By( :Model )
					);

// Loop over the control chart reports
for(r=1, r<=NItems(cc), r++,
	ccRep = Report(cc[r]);
	// Extract the level of 'Model' from the title of the outline node
	title = ccRep[OutlineBox(1)] << getTitle;
	delimPos = Munger(title, 1, "=");
	level = Substr(title, delimPos+1, Length(title)-delimPos);
	// Get the reference value and plot it using a graphics script
	ref = refVal[Loc(modelVal, level)];
	Eval(
		Substitute(
				Expr(ccRep[FrameBox(1)] << addGraphicsScript(PenColor("Blue"); HLine(TBD))),
				Expr(TBD),
				ref[1]
				);
			);
);- Mark as New
- Bookmark
- Subscribe
- Mute
- Subscribe to RSS Feed
- Get Direct Link
- Report Inappropriate Content
Re: How to add reference lines from a reference line table into a control charts or variability char
The code below will produce:
and should get you started. You can use 'Help > Books > Scripting Guide' and 'Help > Scripting Index' to figure out what it's doing. Note that using the titles of the outline nodes is not currently very robust, but this could be improved, or done differently.
NamesDefaultToHere(1);

// Yield table
dt1 =
New Table( "Yield",
	Add Rows( 11 ),
	New Column( "Model",
		Character,
		"Nominal",
		Set Values(
			{"IC1", "IC1", "IC1", "IC2", "IC2", "IC2", "IC2", "IC3", "IC3", "IC3",
			"IC3"}
		)
	),
	New Column( "WaferID",
		Character( 16 ),
		"Nominal",
		Set Values( {"A", "B", "C", "E", "F", "G", "H", "R", "S", "T", "Z"} )
	),
	New Column( "Yield",
		Numeric,
		"Nominal",
		Format( "Best", 12 ),
		Set Values( [50, 60, 70, 30, 40, 50, 60, 80, 90, 70, 65] )
	)
);

// Reference table
dt2 =
New Table( "Reference",
	Add Rows( 3 ),
	New Column( "Model", Character, "Nominal", Set Values( {"IC1", "IC2", "IC3"} ) ),
	New Column( "Value",
		Numeric,
		"Nominal",
		Format( "Best", 12 ),
		Set Values( [50, 40, 70] )
	)
);

// Start here . . .
// Get the values in dt2 into lists for later
modelVal = Column(dt2, "Model") << getValues;
refVal = Column(dt2, "Value") << getValues;

// Control Charts
cc = dt1 << Control Chart(
						Sample Label( :WaferID ),
						Chart Col( :Yield, Individual Measurement ),
						By( :Model )
					);

// Loop over the control chart reports
for(r=1, r<=NItems(cc), r++,
	ccRep = Report(cc[r]);
	// Extract the level of 'Model' from the title of the outline node
	title = ccRep[OutlineBox(1)] << getTitle;
	delimPos = Munger(title, 1, "=");
	level = Substr(title, delimPos+1, Length(title)-delimPos);
	// Get the reference value and plot it using a graphics script
	ref = refVal[Loc(modelVal, level)];
	Eval(
		Substitute(
				Expr(ccRep[FrameBox(1)] << addGraphicsScript(PenColor("Blue"); HLine(TBD))),
				Expr(TBD),
				ref[1]
				);
			);
);- Mark as New
- Bookmark
- Subscribe
- Mute
- Subscribe to RSS Feed
- Get Direct Link
- Report Inappropriate Content
Re: How to add reference lines from a reference line table into a control charts or variability char
Thank you so much Ian. This works great.

- Mark as New
- Bookmark
- Subscribe
- Mute
- Subscribe to RSS Feed
- Get Direct Link
- Report Inappropriate Content
Re: How to add reference lines from a reference line table into a control charts or variability char
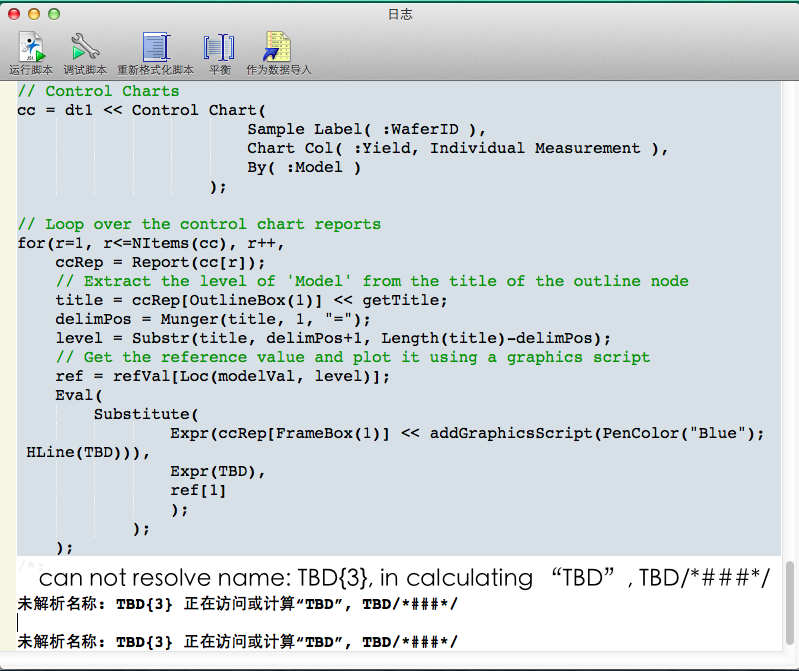
I tested this JSL on my Chinese JMP11. Get the following report in log. Still i can not draw reference line. Can you explain for me?
GMan
- Mark as New
- Bookmark
- Subscribe
- Mute
- Subscribe to RSS Feed
- Get Direct Link
- Report Inappropriate Content
Re: How to add reference lines from a reference line table into a control charts or variability char
Loaclising JSL into the different languages that JMP supports is perfectly possible, but takes a certain extra effort. For some details on how this can be done, see the Discovery paper by @hecht_jmp. For example, if you are working with outline nodes (as in the code above), and you reference them by name, this will almost certainly fail. On the other hand, referencing by number (as in the code above), may fail if the the structure of the report changes (for example, if the contents of the report are made richer between releases).
Probably it's best to send an email to [email protected] and point them to this thread.

- Mark as New
- Bookmark
- Subscribe
- Mute
- Subscribe to RSS Feed
- Get Direct Link
- Report Inappropriate Content
Re: How to add reference lines from a reference line table into a control charts or variability char
I took a different route. I split the Yield column by Model to create a separate column per Model. Then using Column Properties > Spec Limits > Target, entered the expected values (which are essentially targets, no?). See attached file.
Recommended Articles
- © 2026 JMP Statistical Discovery LLC. All Rights Reserved.
- Terms of Use
- Privacy Statement
- Contact Us