- Don’t miss your chance to experience Discovery Summit Europe at our best available rate! Early bird registration through 31 Oct.
- Graph Builder Toolbar streamlines interactive graphing. Creates shortcuts on Report and GraphBuilder Helpers toolbars. Download and install the extension.
- JMP will suspend normal business operations for our Rest and Recharge Day on Friday, October 2, 2026.
Regular business hours will resume on Monday, October 5, 2026.
- Subscribe to RSS Feed
- Mark Topic as New
- Mark Topic as Read
- Float this Topic for Current User
- Bookmark
- Subscribe
- Mute
- Printer Friendly Page
Discussions
Solve problems, and share tips and tricks with other JMP users.- User Community
- :
- Discussions
- :
- Re: how to add legends to a graph ?

- Mark as New
- Bookmark
- Subscribe
- Mute
- Subscribe to RSS Feed
- Get Direct Link
- Report Inappropriate Content
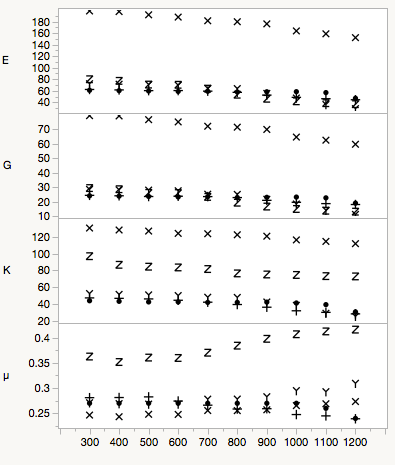
How to add legends to scatterplots from Graph builder, or Fit Y by X?
in the scattered plot i want to add represent what hash, boxes mean i guess it is called as legend entry. I want to add it to the graph.
Accepted Solutions

- Mark as New
- Bookmark
- Subscribe
- Mute
- Subscribe to RSS Feed
- Get Direct Link
- Report Inappropriate Content
Re: how to add legends to a graph ?
Here is the link to the graph builder legend documentation:
In the fit Y-by-X platform you can right click and select "Row Legend" to color and add a legend to your plot based on a column. When looking for such items 1. red triangle, 2. right click, 3. Google key word + JMP, 4. JMP community. If you still can't find what you are looking for if you can share your data table (Tables > Anonymize) then someone can probably help you quickly.
Karen
- Mark as New
- Bookmark
- Subscribe
- Mute
- Subscribe to RSS Feed
- Get Direct Link
- Report Inappropriate Content
Re: how to add legends to a graph ?
Here is the link to the graph builder legend documentation:
In the fit Y-by-X platform you can right click and select "Row Legend" to color and add a legend to your plot based on a column. When looking for such items 1. red triangle, 2. right click, 3. Google key word + JMP, 4. JMP community. If you still can't find what you are looking for if you can share your data table (Tables > Anonymize) then someone can probably help you quickly.
Karen
Recommended Articles
- © 2026 JMP Statistical Discovery LLC. All Rights Reserved.
- Terms of Use
- Privacy Statement
- Contact Us