- Don’t miss your chance to experience Discovery Summit Europe at our best available rate! Early bird registration through 31 Oct.
- Graph Builder Toolbar streamlines interactive graphing. Creates shortcuts on Report and GraphBuilder Helpers toolbars. Download and install the extension.
- JMP will suspend normal business operations for our Rest and Recharge Day on Friday, October 2, 2026.
Regular business hours will resume on Monday, October 5, 2026.
- Subscribe to RSS Feed
- Mark Topic as New
- Mark Topic as Read
- Float this Topic for Current User
- Bookmark
- Subscribe
- Mute
- Printer Friendly Page
Discussions
Solve problems, and share tips and tricks with other JMP users.- User Community
- :
- Discussions
- :
- How to access/change box plot colors in script

- Mark as New
- Bookmark
- Subscribe
- Mute
- Subscribe to RSS Feed
- Get Direct Link
- Report Inappropriate Content
How to access/change box plot colors in script
Hello,
I am wrinting scripts to automatically collect data and make graphs...
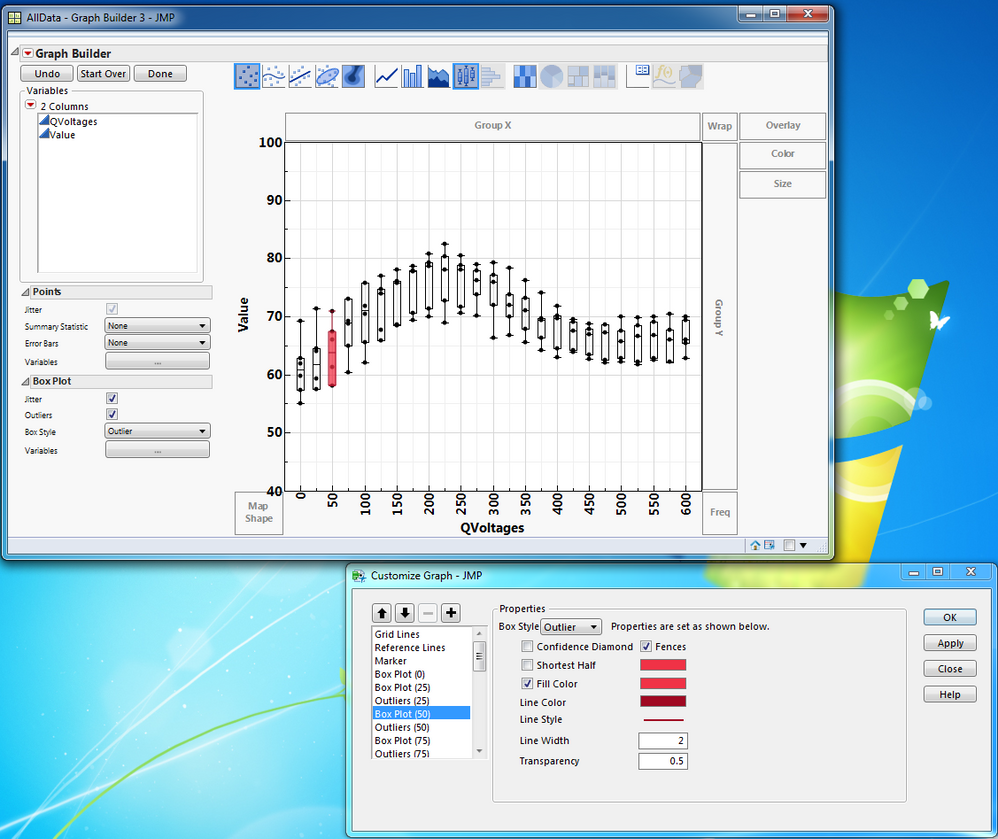
My issue is that I get a graph with varying number of box plots (26 boxes in the example attached), I would like to change the box plot properties (Fillcolor, line color, transparency,...) but I do not know how to access the 26 box plots at a time or seperatly (but via a script)...
I checked manually and I see that there are several boxplot objects: I even modified manually the color of Box Plot (50), but when I look at the script and try to modifyu it, it does not work...
So my question: How to ask and get the references to all the boxplots ?
And how to change their properties (all of them) ?
Many thanks.
PS: for ease, I included a graph and the original table I used (the script is embedded in the data table). The script I get is also added.
Graph Builder(
	Show Legend( 0 ),
	Y Group Title Orientation( "Horizontal" ),
	Y Group Level Orientation( "Horizontal" ),
	Variables( X( :QVoltages ), Y( :Value ) ),
	Elements(
		Points( X, Y, Legend( 1 ), Jitter( 1 ) ),
		Box Plot(
			X,
			Y,
			Legend( 3 ),
			Jitter( 1 ),
			Outliers( 1 ),
			Box Style( "Outlier" )
		)
	),
	SendToReport(
		Dispatch(
			{},
			"QVoltages",
			ScaleBox,
			{Show Major Grid( 1 ), Show Minor Grid( 1 ), Inside Ticks( 1 ),
			Rotated Labels( "Vertical" )}
		),
		Dispatch(
			{},
			"Ron_1p5V [Ohm]",
			ScaleBox,
			{Min( 40 ), Max( 100 ), Inc( 10 ), Minor Ticks( 1 ),
			Show Major Grid( 1 ), Show Minor Grid( 1 ), Inside Ticks( 1 )}
		),
		Dispatch( {}, "graph title", TextEditBox, {Set Text( "" )} ),
		Dispatch( {}, "Y title", TextEditBox, {Set Text( "Value" )} ),
		Dispatch(
			{},
			"Graph Builder",
			FrameBox,
			{DispatchSeg(
				Box Plot Seg( "Box Plot (50)" ),
				{Box Style( "Outlier" ), Line Color( "Dark Red" ), Line Width( 2 ),
				Fill Color( "Red" ), Transparency( 0.5 )}
			)}
		)
	)
)- Mark as New
- Bookmark
- Subscribe
- Mute
- Subscribe to RSS Feed
- Get Direct Link
- Report Inappropriate Content
Re: How to access/change box plot colors in script
Thanks a lot guys !
I am now ready for fency things :)
- « Previous
-
- 1
- 2
- Next »
Recommended Articles
- © 2026 JMP Statistical Discovery LLC. All Rights Reserved.
- Terms of Use
- Privacy Statement
- Contact Us