- Mark as New
- Bookmark
- Subscribe
- Mute
- Subscribe to RSS Feed
- Get Direct Link
- Report Inappropriate Content
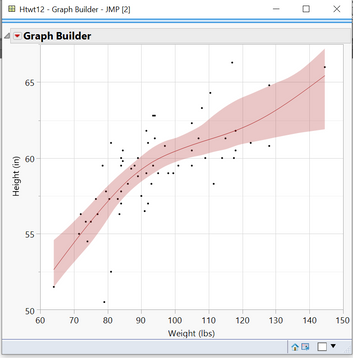
How does JMP construct confidence interval for spline fit in Graph Builder?
I have a method to get the predicted Y from X value using Spline Fitting, but I want to quantify the confidence interval. I noticed it's not possible to do it in Bivariate plots but Graph builder can do this. How does Graph Builder to it (in terms of algorithm)? I want to do the same for bivariate plots fitted with spline fit.
- Mark as New
- Bookmark
- Subscribe
- Mute
- Subscribe to RSS Feed
- Get Direct Link
- Report Inappropriate Content
Re: How does JMP construct confidence interval for spline fit in Graph Builder?
Hi,
I can't find much in the way of documentation on this. What I do know is that the confidence interval is constructed using bootstrap estimation. You should be able to find general information about bootstrap estimation.
Basically:
1. Create a bootstrap sample with replacement. That is, randomly draw rows of data. Each time you draw a row you make that row available in the next draw. Keep drawing until you have as many rows as in the original data. Some rows will be duplicated, triplicated, etc. Other rows will not be in the bootstrap sample.
2. Fit the smoother to the bootstrap sample.
3. Repeat steps 1 and 2 many times.
4. Construct the confidence interval such that it contains 95% of the smoother fits.
I hope that helps.
Phil
- Mark as New
- Bookmark
- Subscribe
- Mute
- Subscribe to RSS Feed
- Get Direct Link
- Report Inappropriate Content


