- Subscribe to RSS Feed
- Mark Topic as New
- Mark Topic as Read
- Float this Topic for Current User
- Bookmark
- Subscribe
- Mute
- Printer Friendly Page
Discussions
Solve problems, and share tips and tricks with other JMP users.- JMP User Community
- :
- Discussions
- :
- Re: How do you add a title to a box plot?
- Mark as New
- Bookmark
- Subscribe
- Mute
- Subscribe to RSS Feed
- Get Direct Link
- Report Inappropriate Content
How do you add a title to a box plot?
In the JMP report window for the analysis I've just done, one the the results is a set of box plots all together in the same graph. That's exactly how I want it to look. I want to add this graph into a paper, which would be fine but I can't figure out how to add a title to it. I'm not working in the graph builder. I am working in the report window.
Just double clicking on the title next to the red triangle and editing that doesn't really help because, if you copy and paste the graph into a word document, that title does not come along for the ride.
I can figure out everything else: editing the axes, changing the colors, fonts, adding a legend, etc. I just can't figure out how to get a title across the top. How do you add one? Or, alternatively, is there a way to export it out so the title next to the red triangle is included in the graph?
- Mark as New
- Bookmark
- Subscribe
- Mute
- Subscribe to RSS Feed
- Get Direct Link
- Report Inappropriate Content
Re: How do you add a title to a box plot?
If you include the title in the selection you are making, it will copy it go Word as a title.
Here is a simple graph with the title changed.
If you go to the tool bar and select the selection tool "+"
You can then click on the title and it will include the title and the complete graph
So when you copy and paste this selected area into a word document it brings the title along as a title
- Mark as New
- Bookmark
- Subscribe
- Mute
- Subscribe to RSS Feed
- Get Direct Link
- Report Inappropriate Content
Re: How do you add a title to a box plot?
I'd like to add in to Jim's response.
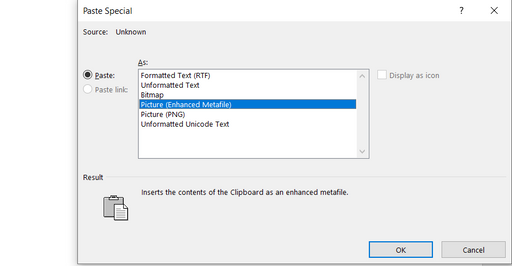
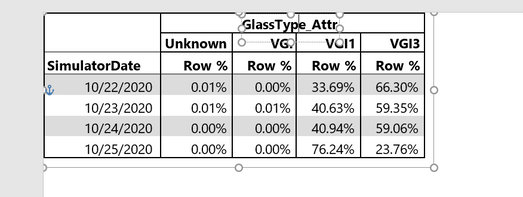
You can actually do further editing if you use Paste Special function in Word after you copy from JMP. Choose Picture (Enhanced Metafile)
If you right click on the picture, you can actually edit it within Word
Recommended Articles
- © 2026 JMP Statistical Discovery LLC. All Rights Reserved.
- Terms of Use
- Privacy Statement
- Contact Us


