- Subscribe to RSS Feed
- Mark Topic as New
- Mark Topic as Read
- Float this Topic for Current User
- Bookmark
- Subscribe
- Mute
- Printer Friendly Page
Discussions
Solve problems, and share tips and tricks with other JMP users.- JMP User Community
- :
- Discussions
- :
- Re: How do automatically move the horizontal scroll bar of the graphics window t...
- Mark as New
- Bookmark
- Subscribe
- Mute
- Subscribe to RSS Feed
- Get Direct Link
- Report Inappropriate Content
How do automatically move the horizontal scroll bar of the graphics window to the far right?
Hello!
I used the following code to create a graphical window.How do I automatically move the horizontal scroll bar of the graphics window to the far right?
Thanks!
nw = New Window( "", dt << Get As Report );
Current Data Table( nw );
nw << Select Columns( 4 );
nw << Go To( 4 );
Wait( 0 );
- Mark as New
- Bookmark
- Subscribe
- Mute
- Subscribe to RSS Feed
- Get Direct Link
- Report Inappropriate Content
Re: How do automatically move the horizontal scroll bar of the graphics window to the far right?
The variable "nw" when used as a reference to a New Window() function becomes a pointer to the DisplayBox for the window.
When you then pass the message of << get As Report to a data table, JMP takes to data table that "dt" is pointing to and creates a Table Box() object representative of the data table. In the below example
names default to here(1);
dt=
// Open Data Table: big class.jmp
// → Data Table( "big class" )
Open( "$SAMPLE_DATA/big class.jmp" );

nw = New Window( "", dt << Get As Report );
This representation of the data table is no longer a data table. It is a display object called a TableBox() object. Communication with a TableBox() is through a different set of messages and commands from what is used to control and manipulate a data table.
Therefore,
Current Data Table( nw );is not valid.
See the Scripting Index for the messages available to the Table Box().
- Mark as New
- Bookmark
- Subscribe
- Mute
- Subscribe to RSS Feed
- Get Direct Link
- Report Inappropriate Content
Re: How do automatically move the horizontal scroll bar of the graphics window to the far right?
Thank Jim!
I checked the index and still didn't understand.
- Mark as New
- Bookmark
- Subscribe
- Mute
- Subscribe to RSS Feed
- Get Direct Link
- Report Inappropriate Content
Re: How do automatically move the horizontal scroll bar of the graphics window to the far right?
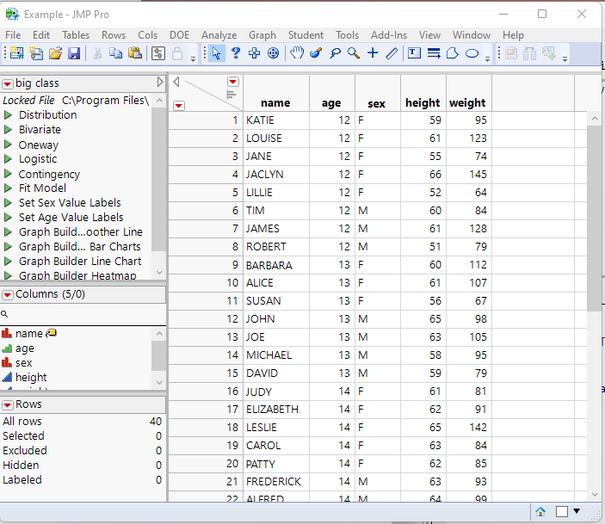
Your example, setting a data table into a Data Grid Box(), appears much closer to what a data table looks like.
names default to here(1);
dt=
// Open Data Table: big class.jmp
// → Data Table( "big class" )
Open( "$SAMPLE_DATA/big class.jmp" );

nw = New Window( "Example", ,x=data grid box() );
dtx = x << set data table(dt);
However, JMP has actually created a Data Browser Box. Viewing the Tree Structure of display window shows the makeup of the Display Object. The easiest way to access this, is to right click on any of the grey triangles in front of the Outline Boxes in the display and selecting
Edit=>Show Tree Structure
The issue with your example code, is that it does not contain any Outline Boxes. Therefore, I just modified your code and added in a a simple Outline Box().
names default to here(1);
dt=
// Open Data Table: big class.jmp
// → Data Table( "big class" )
Open( "$SAMPLE_DATA/big class.jmp" );

nw = New Window( "Example", ob=outlinebox("test",x=data grid box() ));
dtx = x << set data table(dt);
From the Display Tree output, one can see the Data Browser Box
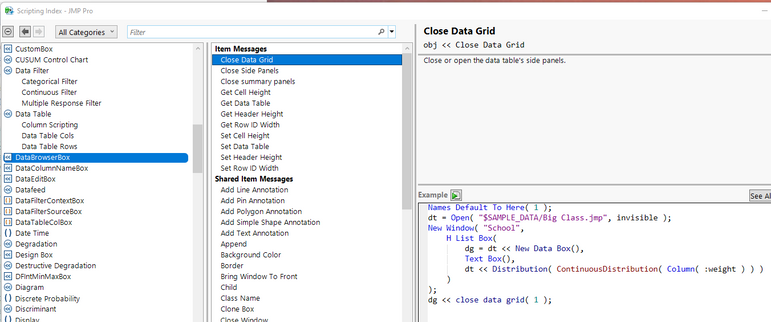
To see what messages are available to manipulate a Data Browser Box, one needs to go to the Scripting Index.
While there are a few messages that are similar to what can be done with a Data Table, there are no messages that control the scrolling of the window.
- Mark as New
- Bookmark
- Subscribe
- Mute
- Subscribe to RSS Feed
- Get Direct Link
- Report Inappropriate Content
Re: How do automatically move the horizontal scroll bar of the graphics window to the far right?
Thank Jim!
I neet that control the scrolling of the window.
However, after I saved it as an image, there was no need for this control.
Recommended Articles
- © 2026 JMP Statistical Discovery LLC. All Rights Reserved.
- Terms of Use
- Privacy Statement
- Contact Us


