- Subscribe to RSS Feed
- Mark Topic as New
- Mark Topic as Read
- Float this Topic for Current User
- Bookmark
- Subscribe
- Mute
- Printer Friendly Page
Discussions
Solve problems, and share tips and tricks with other JMP users.- JMP User Community
- :
- Discussions
- :
- Re: How do I set up a prospective power calculation?
- Mark as New
- Bookmark
- Subscribe
- Mute
- Subscribe to RSS Feed
- Get Direct Link
- Report Inappropriate Content
How do I set up a prospective power calculation?
I am teaching a 2nd semester stat methods course to grad students not in statistics. This year is the first time in 8 years that I have taught it. 8 years ago, everything was SAS-based. This year, I am letting students choose among R (which I can support easily), SAS (also easily supported) and JMP (also easily supported for most things). My issue is setting up a power / sample size calculation in JMP. As far as I can tell, JMP requires you to set up an analysis, perhaps with mock data, then revise sigma, delta, and n for the situation at hand. I can do that either after Fit Y by X / pooled t-test or Fit model dialogs.
My concern is that the JMP result differs from hand-calculations, R computations, and SAS computations (all essentially the same). Here's what I'm asking in the upcoming homework (slightly different language because the actual HW problem is part c in a sequence of questions).
Imagine a two independent sample comparison of means. Assume sigma = 4.1 and delta (difference in means) = 5.98. If you use n=5 for each group, what is the power of an alpha = 0.05 two sample t-test? JMP tells me 0.59:
SAS (proc power; twosamplemeans test=diff stddev=4.1 npergroup=5 meandiff=5.98 power=.;
run; and R (power.t.test(n=5, delta=5.98, sd=4.1, strict=TRUE)
give me 0.527. Hand calculation using a shifted-t approximation gives me essentially 0.5.
What am I doing wrong when I set up the problem in JMP. More particularly, what do tell the JMP-using students on Friday so they can do the problems correctly?
Thanks,
Philip Dixon
- Mark as New
- Bookmark
- Subscribe
- Mute
- Subscribe to RSS Feed
- Get Direct Link
- Report Inappropriate Content
Re: How do I set up a prospective power calculation?
The power calculation tool is "hidden" in the DOE toolbar and is represented by a calculator icon. Alternatively, it is accessible in the DOE Menu > Design Diagnostic > Power Calculator.
Best,
TS
- Mark as New
- Bookmark
- Subscribe
- Mute
- Subscribe to RSS Feed
- Get Direct Link
- Report Inappropriate Content
Re: How do I set up a prospective power calculation?
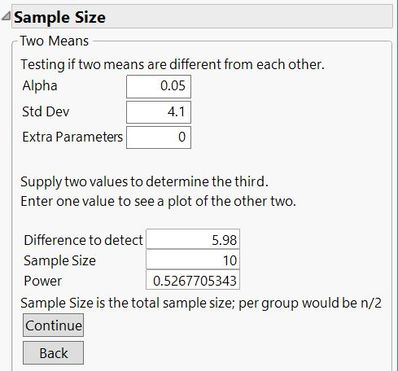
The issue is your sample size. If n=5 for each group, your total sample size is 10. JMP is looking for total sample size, and assumes the samples are equally distributed between the two groups (or as close to it as you can get).
If you have a situation where you want unbalanced samples, then you do go with the "mock data" approach, which makes sense. If you are using a sample size calculator to plan data collection, you should plan on balance -- a desirable property.
Oh, and as @Thierry_S pointed out, there is a spot to get sample size and power. Using that dialog, I chose Two Sample Means, entered your information and get this result which matches the other packages.
Recommended Articles
- © 2026 JMP Statistical Discovery LLC. All Rights Reserved.
- Terms of Use
- Privacy Statement
- Contact Us


