- Instantly extract effect sizes, F-ratios, and FDR-adjusted p-values from your models with the Calculate Effects Sizes extension, available now in the JMP Marketplace!
- New to JMP? Join us Sept. 23-24 for the Early User Edition of Discovery Summit, tailor-made for new users. Register now for free!
- See how to use the JMP Marketplace – Free tools to expand JMP capabilities. Register. July 10, 2 pm US Eastern Time.
- Subscribe to RSS Feed
- Mark Topic as New
- Mark Topic as Read
- Float this Topic for Current User
- Bookmark
- Subscribe
- Mute
- Printer Friendly Page
Discussions
Solve problems, and share tips and tricks with other JMP users.- JMP User Community
- :
- Discussions
- :
- How do I put N of the overlay variable onto a graph?

- Mark as New
- Bookmark
- Subscribe
- Mute
- Subscribe to RSS Feed
- Get Direct Link
- Report Inappropriate Content
How do I put N of the overlay variable onto a graph?
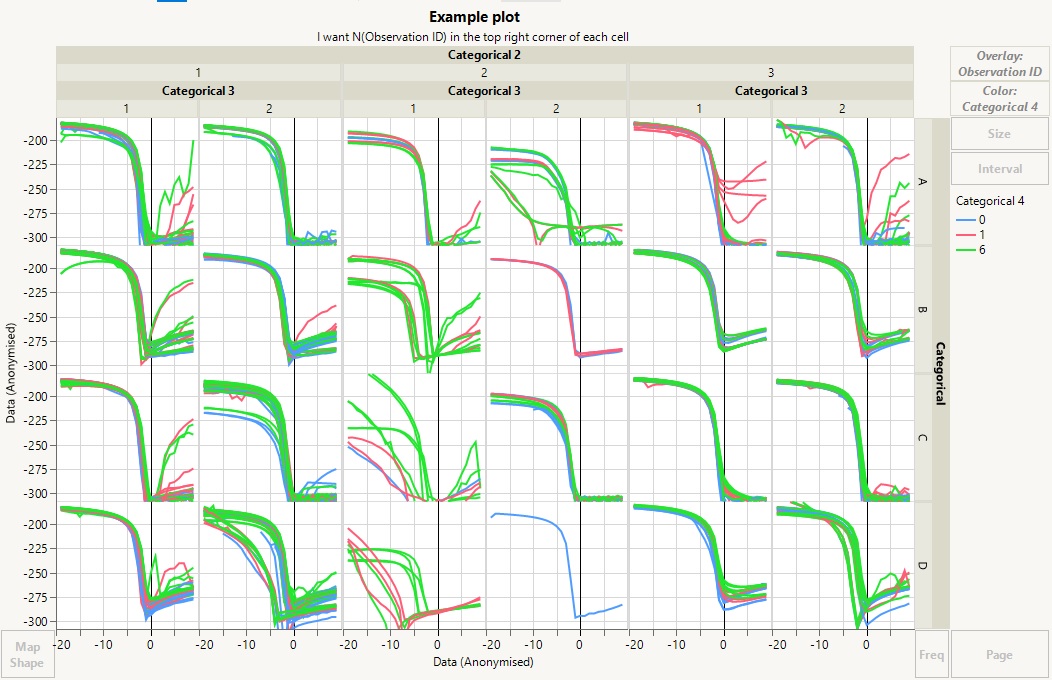
One of the data visualisations I am routinely producing is a set of X/Y data grouped by categorical variables in two dimensions to produce a square array of plots: see attached example. I further Overlay the X/Y data by an observation ID in order to connect all the data points from one observation with a line (placing another variable into the Color axis in order to keep the resulting plot readable).
I cannot guarantee that each of the cells in this array of plots has the same occupancy, for technical reasons. Therefore, the team members using the data that I am creating need to know exactly how many observations (unique values of the observation ID) are present in each cell, because otherwise the visualisation has the potential to mislead.
Because I am using the Overlay axis, if I use a Caption Box then I get one caption per value of the observation ID: what I have been asked to provide is one caption per cell, counting the number of unique values of observation ID there are in that cell.
Of course this can be worked around by manually adding labels into each cell, but this is distinctly laborious. Of course I can provide other visualisations, but my team members have requested this specific visualisation.
Am I overlooking a feature that will do this simply?

Accepted Solutions

- Mark as New
- Bookmark
- Subscribe
- Mute
- Subscribe to RSS Feed
- Get Direct Link
- Report Inappropriate Content
Re: How do I put N of the overlay variable onto a graph?
What I believe you will need to do, is to add a customized piece of JSL to your Graph Builder. Each of the individual graphs can be addressed, and a script can be written to add the appropriate N value into each. Below is a very simple example based upon a simpler graph, but it should give you an idea on how to do this

Names Default To Here( 1 );
dt = Open( "$SAMPLE_DATA/Big Class.jmp" );

gb = dt << Graph Builder(
	Size( 525, 496 ),
	Show Control Panel( 0 ),
	Variables(
		X( :weight ),
		Y( :height ),
		Group X( :age ),
		Overlay( :sex )
	),
	Elements( Line( X, Y, Legend( 8 ) ) )
);

// Get the counts for each of the ages
Summarize( dt, groupBy = By( :Age ), N = Count( :Age ) );

// Make sure stats are complete before moving on
wait(0);

// Find the upper right corner axis values so one can back off a bit and place
// the values of N in an appropriate place
// Place the values into a list, which is required for the graphic function
// that is to be used
theList = {};
theList[1] = (Report( gb )[AxisBox( 1 )] << get max) * .85;
theList[2] = (Report( gb )[AxisBox( 2 )] << get max) * .95;

// Now Place the values
For( i = 1, i <= N Items( n ), i++,
	val = "N=" || Char( n[i] );show(val);
	Report( gb )[FrameBox( i )] <<
	add graphics script( Text( Center Justified, theList, val ) );
);- Mark as New
- Bookmark
- Subscribe
- Mute
- Subscribe to RSS Feed
- Get Direct Link
- Report Inappropriate Content
Re: How do I put N of the overlay variable onto a graph?
What I believe you will need to do, is to add a customized piece of JSL to your Graph Builder. Each of the individual graphs can be addressed, and a script can be written to add the appropriate N value into each. Below is a very simple example based upon a simpler graph, but it should give you an idea on how to do this
Names Default To Here( 1 );
dt = Open( "$SAMPLE_DATA/Big Class.jmp" );

gb = dt << Graph Builder(
	Size( 525, 496 ),
	Show Control Panel( 0 ),
	Variables(
		X( :weight ),
		Y( :height ),
		Group X( :age ),
		Overlay( :sex )
	),
	Elements( Line( X, Y, Legend( 8 ) ) )
);

// Get the counts for each of the ages
Summarize( dt, groupBy = By( :Age ), N = Count( :Age ) );

// Make sure stats are complete before moving on
wait(0);

// Find the upper right corner axis values so one can back off a bit and place
// the values of N in an appropriate place
// Place the values into a list, which is required for the graphic function
// that is to be used
theList = {};
theList[1] = (Report( gb )[AxisBox( 1 )] << get max) * .85;
theList[2] = (Report( gb )[AxisBox( 2 )] << get max) * .95;

// Now Place the values
For( i = 1, i <= N Items( n ), i++,
	val = "N=" || Char( n[i] );show(val);
	Report( gb )[FrameBox( i )] <<
	add graphics script( Text( Center Justified, theList, val ) );
);- Mark as New
- Bookmark
- Subscribe
- Mute
- Subscribe to RSS Feed
- Get Direct Link
- Report Inappropriate Content
Re: How do I put N of the overlay variable onto a graph?
Thank you! There are a couple of JSL commands in there that I hadn't come across before, which I think will be key to my solution.
Recommended Articles
- © 2026 JMP Statistical Discovery LLC. All Rights Reserved.
- Terms of Use
- Privacy Statement
- Contact Us