- JMP Statement Regarding Critical PHP Remote Code Execution Vulnerabilities (CVE-2026-109618, CVE-2026-109619)
- Don’t miss your chance to experience Discovery Summit Europe at our best available rate! Early bird registration through 31 Oct.
- Graph Builder Toolbar streamlines interactive graphing. Creates shortcuts on Report and GraphBuilder Helpers toolbars. Download and install the extension.
- Subscribe to RSS Feed
- Mark Topic as New
- Mark Topic as Read
- Float this Topic for Current User
- Bookmark
- Subscribe
- Mute
- Printer Friendly Page
Discussions
Solve problems, and share tips and tricks with other JMP users.- User Community
- :
- Discussions
- :
- How do I overlay box plots in JMP so they are aligned instead of next to each ot...

- Mark as New
- Bookmark
- Subscribe
- Mute
- Subscribe to RSS Feed
- Get Direct Link
- Report Inappropriate Content
How do I overlay box plots in JMP so they are aligned instead of next to each other?
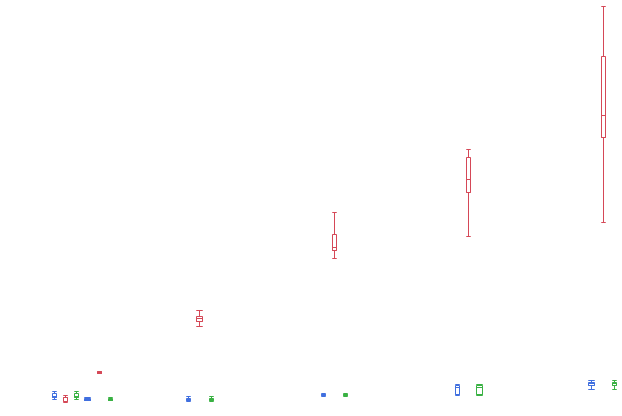
Assuming you have a set of x values (numerical, continuous) and 3 sets of y values (numerical, continuous), is there any way to overlay the series together and have box plots that are overlayed? When I add box plots with graph builder, the box plots take up their own independent space along the x-axis, instead of being aligned along the same value of x, the box plots won't intersect eachother. The box plots become too small and narrow. (Tried with JMP12 and 13).


- Mark as New
- Bookmark
- Subscribe
- Mute
- Subscribe to RSS Feed
- Get Direct Link
- Report Inappropriate Content
Re: How do I overlay box plots in JMP so they are aligned instead of next to each other?
I would use the STACK command to create one X and one Y column. A third column would distinguish which set the X,Y pair came from. Then it's a simple matter of using the third column as your BY variable in the plot.
- Mark as New
- Bookmark
- Subscribe
- Mute
- Subscribe to RSS Feed
- Get Direct Link
- Report Inappropriate Content
Re: How do I overlay box plots in JMP so they are aligned instead of next to each other?
I created one x, one y, and one group column, and used Graph Builder to drag the x to the x, the y to the y, and the group column to the upper right corner "overlay". After selecting box plots on the top, I get the same result as previously.
Recommended Articles
- © 2026 JMP Statistical Discovery LLC. All Rights Reserved.
- Terms of Use
- Privacy Statement
- Contact Us